Who are the most and least “partisan” candidates for WA statewide office?
Often, these sorts of conclusions are argued subjectively in opinion articles based on a candidate’s issue-positions and their endorsements. However, we wanted to ignore the opinions and go straight to the data to draw the conclusions. We used only official public data and all results here are repeatable and could be independently confirmed by following the process we detail below.
First, we will define “most-partisan” to mean “a candidate that only gets votes from their party”, and “least-partisan” to mean “a candidate that got the highest number of votes from the opposite party (ie, cross-over votes)” – specifically when there is a both a Democrat and Republican running in the race. This is difficult to measure because while a candidate’s vote totals are public, the party breakdown of who specifically voted for them is not public. But we can use statistical techniques to infer it, as described below. We’ll use “most independent” as a synonym for “least-partisan”.
Based on statistical analysis of over 150,000 data points across 7000 precincts from the 2016 election results, we conclude Secretary of State Kim Wyman is the least-partisan statewide elected official in WA state. And further analysis shows only the most deeply partisan voters voted against Wyman.
We calculate a “cross over score” for each candidate by using partisan upticket races as a baseline. The candidate with highest cross-over score is the most independent. Looking at 2016 statewide executive races featuring both a Republican and Democrat, here were the results:
| Office | Party | Crossover Score | Upticket Baseline |
| Secretary of State (SOS) | Gop | 13.05% | Senate |
| Insurance Commissioner | Dem | -0.45% | Senate |
| Auditor | Dem | -1.79% | Senate |
| Governor | Dem | -4.65% | Senate |
| Lt. Governor | Dem | -9.00% | Senate |
| Commission of Public Lands | Dem | -10.16% | Senate |
| Office | Party | Crossover Score | Upticket Baseline |
| Secretary of State (SOS) | Gop | 22.06% | Pres. |
| Auditor | Gop | 14.22% | Pres. |
| Insurance Commissioner | Dem | 13.21% | Pres. |
| Auditor | Dem | 12.36% | Pres. |
| Governor | Gop | 11.96% | Pres. |
| Governor | Dem | 10.06% | Pres. |
| Lt. Governor | Gop | 7.94% | Pres. |
| Commission of Public Lands | Gop | 7.59% | Pres. |
| Insurance Commissioner | Gop | 6.18% | Pres. |
| Lt. Governor | Dem | 4.97% | Pres. |
| Commission of Public Lands | Dem | 3.56% | Pres. |
| Secretary of State (SOS) | Dem | 1.17% | Pres. |
Notably, by both metrics, the SOS GOP candidate, Kim Wyman, was the least-partisan candidate.
Interestingly, Wyman’s opponent was also the most-partisan, indicating that only the most partisan voters voted against Wyman.
These findings are also consistent with Wyman’s independence from Trump. A quick sanity check shows notes that Trump got 1,221,747 votes, whereas Wyman got 1,713,004 votes. So Wyman got nearly half a million more votes than Trump – which means there must be a high degree of independence and cross-over voting.
Background:
WA state is organized into 7000 neighborhoods called “precincts”. While individual votes and ballots are private, the precinct-level results are publicly reported. A precinct could contain hundreds of people, and so individual anonymity is still preserved. In other words, your individual vote is private, but the aggregate results for your neighborhood are public.
There are 9 total statewide executive offices. But in 2016, only 6 of these had both a Democrat and Republican running. We will ignore:
- AG because no Republican ran
- Treasurer because no Democrat ran.
- SPI because it’s non-partisan.
That leaves us with these 6 downticket offices (winners in bold):
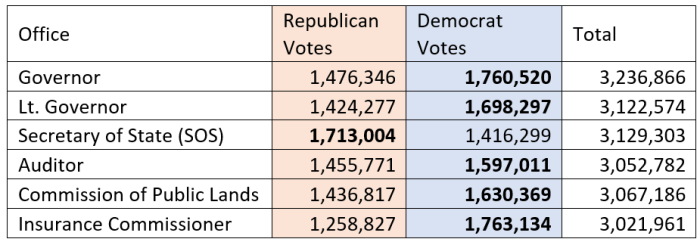
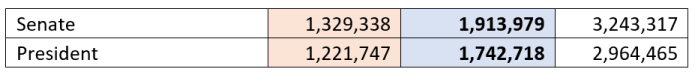
And these upticket offices:
Note that for president, 5.01% voted libertarian and 7.6% voted for other 3rd-party candidates. Since this is a partisan analysis between the 2 major parties, and the numbers are sufficiently small, we’ll ignore those numbers in our initial analysis.
The Theory
First, let’s define some terms:
- “upticket” races as statewide federal races. In 2016, that was President and a U.S. senate race. These are statewide partisan races and often get the most attention, highest voter turnout, and most dollars.
- “downticket” races are the statewide executive races. These are local positions and not federal. In 2016, there were 6 such races with a Democrat and Republican.
- “cross over” votes are votes that voted for a different party upticket and downticket on the same ballot. For our analysis, we will look at each combination of (downticket, upticket) races individually.
For example, if a person A voted for a Democrat President and Republican Governor, that would count as a cross-over vote for the governor candidate.
We will then use cross-over votes to infer how independent or partisan a candidate is. A candidate that gets very few cross-over votes (and only party votes) will be considered partisan. A candidate that gets many cross-over votes will be considered more independent.
For upticket races, we’ll use the statewide federal races: President (Trump vs. Clinton) and U.S. Senate (Vance vs. Murray). Notably, the Republican Senator candidate (Vance) actively did not endorse the Republican President candidate (Trump), so these two races provide two very different flavors of a “Republican”. We’ll run the analysis against both to ensure balanced results.
The challenge then becomes: while we know the total votes for each candidate, the ballots are secret, so how do we figure out the cross-over votes?
We can use a multiple-linear regression over the 7000 precinct results to statistically infer a reliable cross-over voting rate. Here’s how…
The Math
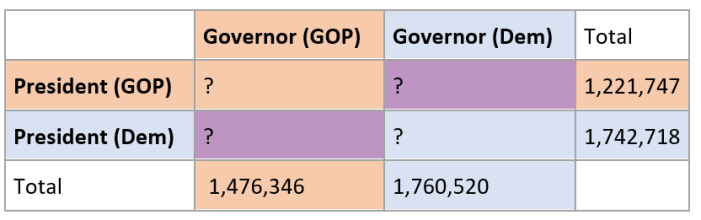
We know how many people voted for each candidate. For example, for the Presidential race, the GOP candidate got 1.2 million votes and the Dem candidate got 1.7 million votes. Similarly, for the Governor’s race, the GOP candidate got 1.4 million votes and the Dem candidate got 1.7 million votes. This table shows cross-over votes, where the purple square indicate party cross-over:
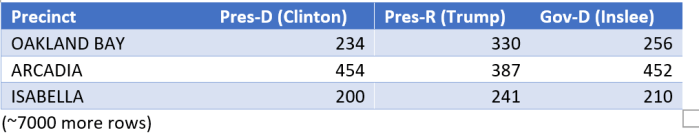
We know how each total is split up across each 7000 precincts. We can view this as a table where each row is a precinct, and we have a column per candidate. For example, this table shows that the D presidential candidate (Clinton) got 454 raw votes in the “Arcadia” precinct.
We can represent that as a matrix equation, where the columns become vectors:
Or to substitute some numbers:

(Each of these vectors would have an element per precinct, and so be ~7000 elements long)
Or more generically:
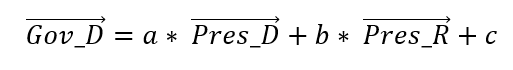
Where the ith element of vector Gov_D is the number of absolute votes that candidate received in the ith precinct.
And:
a = % of people that voted for R President and voted for Dem governor. (Non-crossover. The “base coefficient”)
b = % of people that voted for D President and voted for Dem governor. (the “Crossover coefficient”)
c = people that voted for R governor that did not vote for president. In practice, this is usually miniscule since the top of the ticket gets the most votes. (the “intercept”)
We can then use a multiple linear regression to “solve” for a (the base coefficient) and b (the cross-over coefficient).
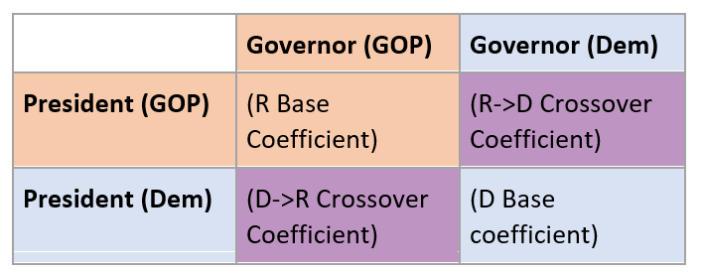
Visually, these coefficients we’re solving for are:
For example, when we calculate the coefficients for the Democrat governor candidate, we get:
(R->D crossover coefficient, D-Base coefficient, Intercept) = (10.06%, 94.60%, -1.50)
As expected, the base coefficient is close to 100% (since most people that vote for a democrat president will also vote for a democrat governor). The crossover coefficient is lower. The intercept is negligible and can be ignored. We can repeat that for the Republican governor candidate, and then use those regression coefficients to fill in the missing values!
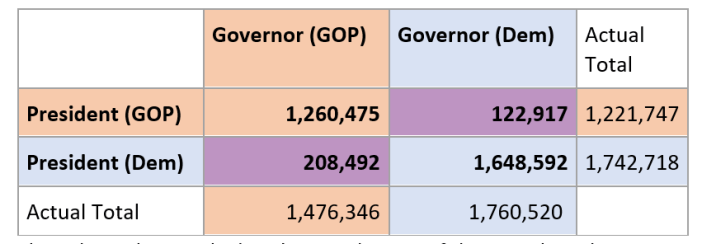
The sub totals we calculated are within 1% of the actual total.
This is showing that the GOP governor candidate (Bryant) got about 208k cross-over votes (from Clinton). This gives us tangible insight we can use to identify which candidates attracted the most crossover votes.
At first this may seem impossible to estimate, but remember:
- The estimate is based on minor observations in fluctuations across 7000 precinct results.
- Individual ballots are still private and we still don’t know who specifically those 208k voters are.
The results
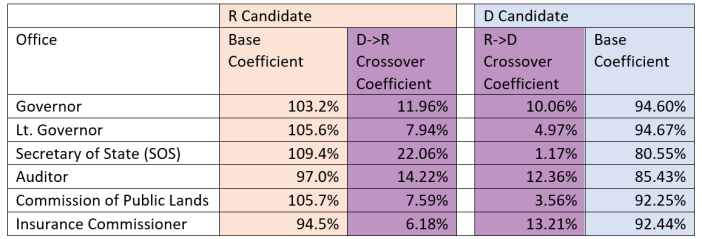
We evaluated 6 downticket offices, a D and R candidate per office, so a total of 12 candidates. Here were the results of running a regression for each downticket candidate against the Presidential results:
The cross over scores are in purple – this is where a R candidate got votes from a D presidential candidate or vice versa.
Here are similar results showing the winner from each downticket office and comparing them to the U.S. Senate candidates.
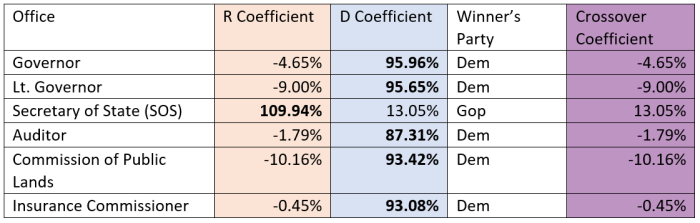
From here, we take the crossover coefficients and call that the “cross over score”. We could go ahead and compute the actual number of cross over votes for each, but that would give you the same ordering as just comparing the coefficients.
These coefficients form the table we shared at the start of the article.
Conclusion
It is possible to use statistics on the public election data to objectively make meaningful conclusions for things that would otherwise be considered an opinion.
At Voter-Science, we hope to advance the caliber of discussion by focusing on data over opinions. We recognize the approach above is one way to analyze this process and welcome dialog about other techniques that could be applied here.
—
See Also:
- How many votes will it take for the GOP to win the 2020 governor’s race in Washington State?
- Is Washington State Gerrymandered?
- Measuring the Trump Effect (Updated 11/15)
