Voter registration for Nov 8th, 2016 in WA has closed and here’s a breakdown of some late registration trends.
The average age of a recently registered voters is 37, roughly 11 years younger than the average age of all voters. This trend is consistent across all 49 legislative districts.
Here’s a breakdown by legislative district, showing average ages of All voters, only voters registered 2016, and the difference between them.
|
Leg. District
|
All Voters
|
Registered in 2016
|
Difference
|
|
15
|
47.2
|
33.2
|
14.0
|
|
43
|
41.7
|
33.2
|
8.5
|
|
9
|
47.5
|
34.1
|
13.3
|
|
29
|
45.8
|
35.1
|
10.6
|
|
36
|
44.6
|
35.2
|
9.4
|
|
28
|
48.2
|
35.3
|
12.9
|
|
44
|
46.8
|
35.5
|
11.2
|
|
46
|
47.3
|
35.7
|
11.6
|
|
27
|
47.2
|
36.2
|
11.0
|
|
25
|
47.6
|
36.3
|
11.3
|
|
40
|
49.4
|
36.4
|
13.1
|
|
1
|
47.4
|
36.6
|
10.9
|
|
2
|
47.2
|
36.6
|
10.6
|
|
45
|
48.0
|
36.8
|
11.3
|
|
5
|
47.6
|
36.8
|
10.8
|
|
38
|
48.2
|
36.9
|
11.3
|
|
21
|
48.0
|
36.9
|
11.1
|
|
48
|
48.8
|
36.9
|
11.8
|
|
39
|
48.5
|
37.1
|
11.5
|
|
16
|
49.5
|
37.1
|
12.4
|
|
17
|
48.1
|
37.1
|
11.0
|
|
23
|
50.3
|
37.1
|
13.2
|
|
41
|
49.4
|
37.2
|
12.1
|
|
47
|
47.4
|
37.3
|
10.1
|
|
6
|
48.8
|
37.3
|
11.4
|
|
18
|
48.7
|
37.3
|
11.4
|
|
3
|
46.4
|
37.4
|
9.1
|
|
31
|
48.3
|
37.5
|
10.8
|
|
11
|
46.6
|
37.5
|
9.1
|
|
14
|
50.6
|
37.5
|
13.1
|
|
30
|
47.9
|
37.7
|
10.2
|
|
22
|
48.5
|
37.7
|
10.8
|
|
49
|
48.8
|
37.9
|
10.9
|
|
13
|
49.6
|
38.0
|
11.7
|
|
8
|
48.9
|
38.1
|
10.9
|
|
37
|
46.0
|
38.1
|
7.9
|
|
32
|
49.1
|
38.3
|
10.8
|
|
33
|
48.3
|
38.4
|
10.0
|
|
26
|
50.3
|
38.6
|
11.7
|
|
34
|
48.4
|
38.6
|
9.8
|
|
4
|
49.1
|
38.6
|
10.5
|
|
42
|
49.0
|
39.8
|
9.2
|
|
35
|
51.6
|
40.1
|
11.5
|
|
12
|
52.0
|
40.4
|
11.5
|
|
20
|
51.1
|
40.6
|
10.4
|
|
10
|
52.7
|
40.8
|
12.0
|
|
7
|
52.0
|
40.8
|
11.2
|
|
19
|
52.1
|
42.0
|
10.1
|
|
24
|
55.6
|
45.9
|
9.7
|
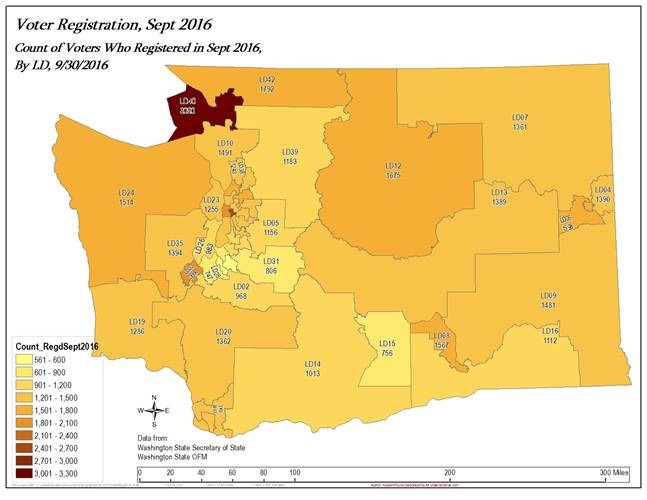
Districts average about a 1% increase from new registrations in ’16.
Here are the top 10 legislative districts by new-registration.
|
Leg. District
|
Number Voters
|
New Registrations
|
% growth
|
|
40
|
100,566
|
3,090
|
3.07%
|
|
43
|
118,302
|
2,516
|
2.13%
|
|
12
|
83,491
|
1,675
|
2.01%
|
|
22
|
108,232
|
2,066
|
1.91%
|
|
42
|
100,282
|
1,792
|
1.79%
|
|
13
|
78,080
|
1,389
|
1.78%
|
|
9
|
83,842
|
1,481
|
1.77%
|
|
8
|
89,393
|
1,567
|
1.75%
|
|
21
|
94,752
|
1,650
|
1.74%
|
|
3
|
86,858
|
1,511
|
1.74%
|
Here are some visualizations of the breakdown.
![clip_image002[6]](https://voter-science.blog/wp-content/uploads/2016/11/clip_image0026_thumb.jpg?w=665&h=516 "clip_image002[6]")
![clip_image004[6]](https://voter-science.blog/wp-content/uploads/2016/11/clip_image0046_thumb.jpg?w=665&h=516 "clip_image004[6]")
![clip_image006[6]](https://voter-science.blog/wp-content/uploads/2016/11/clip_image0066_thumb.jpg?w=665&h=514 "clip_image006[6]")
![clip_image010[6]](https://voter-science.blog/wp-content/uploads/2016/11/clip_image0106_thumb.jpg?w=665&h=516 "clip_image010[6]")
![clip_image008[6]](https://voter-science.blog/wp-content/uploads/2016/11/clip_image0086_thumb.jpg?w=665&h=514 "clip_image008[6]")
![clip_image012[7]](https://voter-science.blog/wp-content/uploads/2016/11/clip_image0127_thumb.jpg?w=665&h=514 "clip_image012[7]")
Have a question about the VRDB? Leave a comment…


![clip_image002[6]](https://voter-science.blog/wp-content/uploads/2016/11/clip_image0026.jpg "clip_image002[6]")
![clip_image004[6]](https://voter-science.blog/wp-content/uploads/2016/11/clip_image0046.jpg "clip_image004[6]")
![clip_image006[6]](https://voter-science.blog/wp-content/uploads/2016/11/clip_image0066.jpg "clip_image006[6]")
![clip_image010[6]](https://voter-science.blog/wp-content/uploads/2016/11/clip_image0106.jpg "clip_image010[6]")
![clip_image008[6]](https://voter-science.blog/wp-content/uploads/2016/11/clip_image00861.jpg "clip_image008[6]")
![clip_image012[7]](https://voter-science.blog/wp-content/uploads/2016/11/clip_image0127.jpg "clip_image012[7]")
