Introducing Canvasser 2.0

For those who didn’t see the demo at Roanoke 2023 or have enrolled as beta testers, it’s my pleasure to introduce you to the v2.0 release of Voter Science Canvasser on Android and iOS. The three major new features included in this release are:

  • New dashboard panel
  • New route detail panel
  • Optimal route generation

Most of these new features have been suggested by users in the field, and I want to thank everyone for providing that valuable feedback during the 2022 campaign season. As a candidate I was also testing the designs first hand, a tradition that at Microsoft we referred to as “eating our own dogfood.”

New Dashboard Panel

Probably the most obvious change that you’ll notice on first launch of the 2.0 release is the new DASH tab on the main screen. This will be familiar if you’ve used VS Fundraiser, and it’s basically loaded with statistics and history for the selected walking list.

Like Fundraiser, the dashboard consists of two animated donut charts that summarize the status of households in the current sheet (To Do, Voted, Complete, etc.) and the result of contact for each that have been visited (Left Literature, Talked with Voter, etc.). The History section contains a list of all the doorbelling sessions for the sheet, broken down by date and by canvasser email. In the detail line for each history entry, you’ll see the number of households canvassed during that session, the total number of voters represented by those households, and the total distance covered.

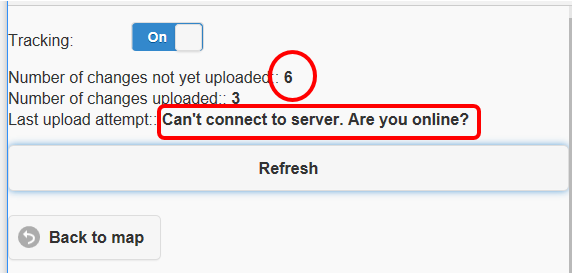
Tapping any of the history entries will show the new route detail panel:

Route Detail Panel

This detail panel roughly shows the path taken canvassing during that session. Since we’re just connecting the positions that were logged in the history by GPS position and timestamp, it’s not necessarily your actual walking path but an approximation. That said, it can quickly identify volunteers who may have tried to canvass their walking list from the local Starbucks. Note that the pins on this path currently represent voters visited, and not households, since that’s how changes are logged. A future update may consolidate those back into households so that you can tap them to navigate to the household detail panel.

Optimal Route Generation

You will notice a new option in Settings > Lists> Sort By:

By selecting the new Route option, Canvasser will generate an optimal route for you to take to canvass the walking list. Creating optimal routes is a generalization of the Travelling Salesman Problem (TSP), which belongs to the class of NP-complete problems. Thus, it is possible that the worst-case running time for any algorithm for the TSP increases superpolynomially (but no more than exponentially) with the number of potential stops, making it impractical to simply brute force. The algorithm that I’ve chosen is a classic pairwise exchange or “2-opt” technique constrained by paths segmented by block and side of the street (thus preventing zig-zag patterns as you progress down the street). This ends up being a decent optimization for canvassing, given that we currently can’t easily constrain to actual street geography.

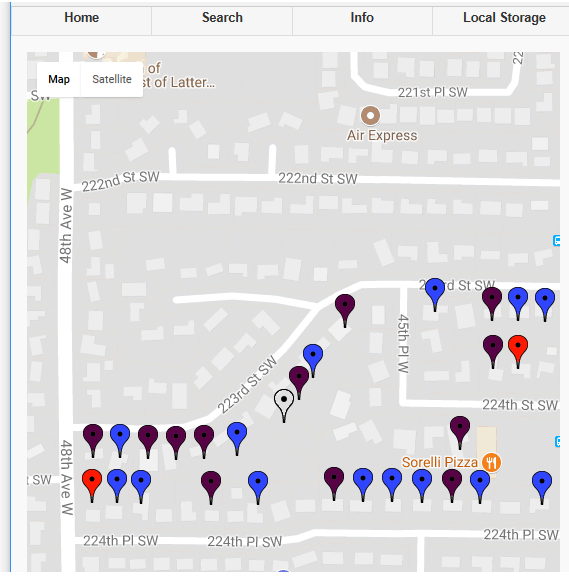
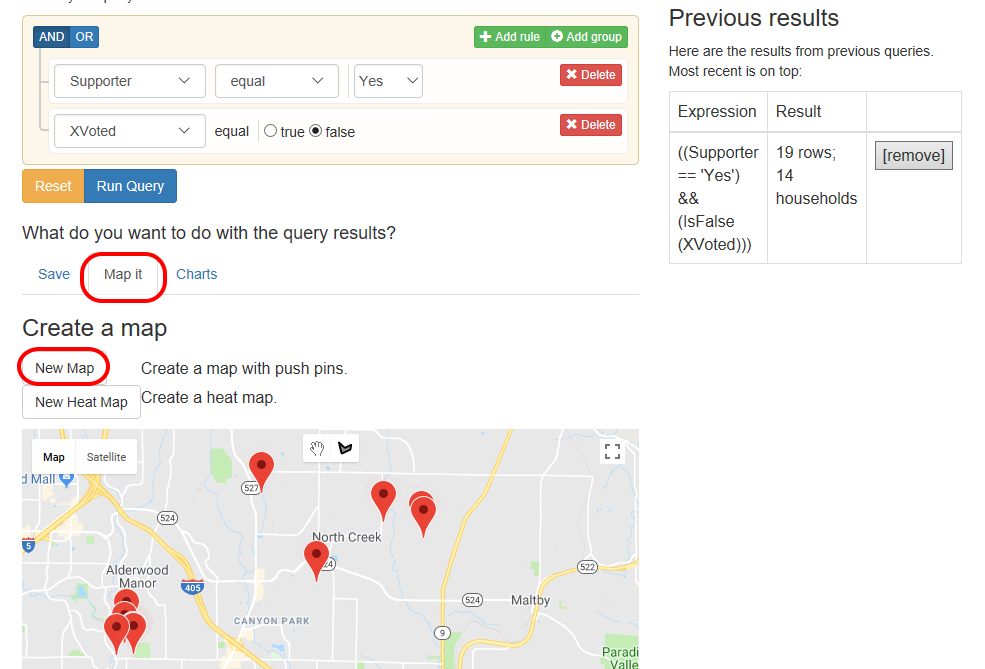
Here’s an example shown on the Hybrid map type:

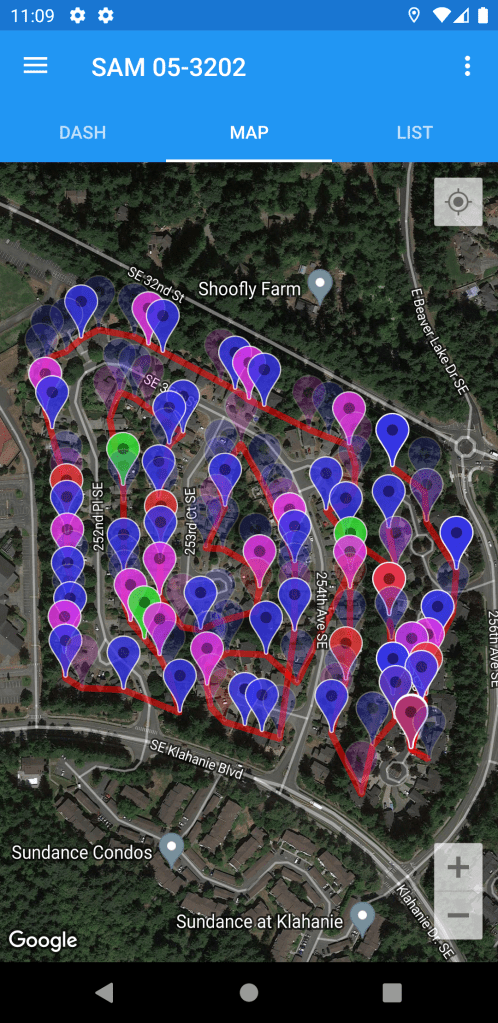
The optimal route is shown with red traces, just like the historical routes shown in the new route detail panel. The List tab is also sorted in the optimal route order, allowing you to just swipe through household detail view to progress through the walking list.

Getting Started

The v2.0 release of VS Canvasser represents a major feature release for the 2023 campaign season, and it is now live on both the Google Play Store and Apple App Stores.

We remain committed to further tactical improvements as the election cycle progresses. If you have any additional feature requests, please send them to chad@voter-science.com and I’ll make every effort to roll them into a future release.

Exporting to a CSV is almost always the wrong thing

In general, when somebody asks to download their TRC data as a CSV, it’s often the wrong thing.  Once you’ve exported to a CSV, you lose out on the benefits of TRC, including our mobile canvassing apps.  It also causes problems like a) how do you keep the downloaded CSV in current with changes; b) how do ensure data collected from that CSV gets uploaded back to your account? And usually there’s a better way to accomplish their scenario…

Continue reading “Exporting to a CSV is almost always the wrong thing”

Changelog for VS Canvasser mobile app

Note that while Android and iOS release versions are coordinated, not every version is released on both platforms.  Generally, the Android builds are a bit more frequent, due to the higher market penetration and the fact that I personally test it in the field daily.

Here is a quick summary of the changes introduced with each release:

Release: 1.5
Sep 5, 9:50 PM: Full rollout. (Promoted from beta 1.5)

– Added voter history into ListView voter description
– Added household count to ListView household icon
– Fixed NullReferenceException in DetailView
– Updated to latest CarouselView and Xamarin.Forms packages
– Replaced various 3rd-party plug-ins with Xamarin.Essentials

Release: 1.4.2
July 24, 2:30 AM: Full rollout. (Promoted from beta 1.4.2)

– Restored WebVew hosted in NavigationPage for login
– Added Log In menu command
– Updated to pre-release Xamarin.Forms (fixed issue #2393)

Release: 1.4.1
July 20, 11:22 PM: Full rollout. (Promoted from beta 1.4.1)

– New menu item to Share sheet with other users
– Added transfer token for Plug-ins button to bypass Web client login
– Switched to using App Center errors to report exception handling
– Switch to CarouselView from Andrei Misiukevich to work around Issue #2637
– Swiping in CarouselView will now wrap around
– Fixed delay in bringing up Settings panel
– Sort by distance is now updated live as position changes

Release: 1.3.6
July 7, 5:10 PM: Full rollout. (Promoted from beta 1.3.6)

– Pins now update color and opacity with incremental sync of voter records

Release: 1.3.5
Jul 3, 11:33 PM: Full rollout. (Promoted from beta 1.3.5)

– Manual upload to cloud now syncs changes in all sheets, not just current one.
– Alert now displayed when manual upload is unsuccessful.
– Fixed closest household button
– Handled phone number formatting overflow
– Streamlined conversion for string types
– Switched to chat keyboard for comments
– Refined voter detail panel

Release: 1.3.3
Jul 1, 9:05 PM: Full rollout. (Promoted from beta 1.3.3)

– App name change to Canvasser, with new adaptive icon
– Back button from main page navigates to parent sheet
– Added Plug-in button in SheetDetailPage
– Added detail section on VoterDetailPage for custom columns
– Preserves last visible region for each sheet
– Fixes missing map pins after extended load
– Updated logic for dimming households (visited or all members dimmed)
– Filtered voters now show as dimmed
– Added automatic sync after connectivity is restored or successful login
– Exception handling for failed OpenSheet (e.g. loss of permission)
– Fixed household member list opacity update
– Updated target URL for Learn More button in About
– Simplification of WebView-based login/logout, with new icon

Release: 1.2.2
Apr 24, 8:33 PM: Full rollout. (Promoted from beta 1.2.2)

– Reverting to CarouselPage to try to work around infrequent crash from ObjectDisposedException
– Maintains sorted order of household members when switching to voter detail page

Release: 1.2.1
Apr 19, 8:37 PM: Full rollout.

– Added SearchBar on List tab
– Added male and female avatars
– Fixed icon color update
– Sorts household members by age
– Possible fix for System.ObjectDisposedException

Release: 1.2
Apr 16, 8:30 AM: Full rollout.

– New buttons on voter detail page to dial phone number and send email
– Auto formatting of phone number (US only)
– Preferred virtual keyboard variants for phone number and email entry
– Upgrade to ProGuard 6.0.2 bytecode optimization

Release: 1.1.3
Apr 12, 4:57 PM: Full rollout. (Promoted from beta 1.1.3)

– Sync changes when app sent to background
– Scroll corresponding list item into view when pin selected on map
– Added completion percentage to the sheet Info page
– Fixed off-by-one bug when applying missed changes from other users

Release: 1.1.2
Apr 6, 10:20 PM: Full rollout.

– Rolled back to Xamarin Forms v2.5.0.280555 to work around WebView login bug

Release: 1.1.1
Apr 6, 3:28 PM: Full rollout.

– Clears WebView cache after logout so that previous user’s cookies aren’t still present
– Fixes performance issues with CarouselPage by switching to CarouselView, which supports UI virtualization
– Fixes a crash when location services goes unexpectedly offline
– Fixed crash caused on some configurations by CarouselView linker error

Release: 1.1
Apr 3, 3:02 PM: Full rollout. (Promoted from beta 1.1)

– Swipe left or right in household or voter detail panels for next & previous
– My location button in household detail view to quickly index to closest address
– New default sorting of households is by address
– Exception handling for failed DateTime parsing

The Data Lifecycle

This article describes a best-practice for campaigns in using data for targeting voters and how you can achieve that with TRC.

The flow here is to start with getting initial public data from the county auditor, merge in microtargeting information, choose the targets, canvass, and iterate on the model.

flowchart

Conceptually, we can think of data like a giant spreadsheet (CSV file). Each row is a voter, and columns are information about that voter.  We’ll walk through the different phases with a small sample of 8 records, but TRC can help you do this with your entire district of 80,000 records

Continue reading “The Data Lifecycle”

How partisan are WA organizational donors?

In previous posts we’ve looked at how our political system has become increasingly polarized, with our analysis of voting records showing that many self-styled moderates and independents are exhibiting much more partisan behavior when voting on the House or Senate floor.  Having served for a few years now on a PDC open data advisory group, I realized that the same type of analysis could be done for organizational donors.  Despite this being public data, not many people in Washington state know who the biggest political donors are, much less who they support.

So, are many of these “non-partisan” or “bi-partisan” organizational donors more partisan than they let on?

We can figure this out, and the methodology is pretty simple.  The PDC Open Data Portal publishes all contributions to candidates and political committees back to 2008.  For this first analysis, we looked at donations to partisan legislative and statewide candidates from businesses, unions and political action committees.  The partisanship score for each donor is the difference in percentage of donations by party, giving each a range from 100 (exclusively Republican) to -100 (exclusively Democrat).

Most of the effort here is involved with the fuzzy matching algorithm, since candidates are very inconsistent on how they report the names of these organizations to the PDC.  I use a trigram matching method, which isn’t perfect…but it does pretty well.  Currently, contributions are grouped under the same donor if 80% or more of the trigrams match, but this is adjustable.

Here are the results:

Partisan Donors (2008-18)

If you visit WhipStat.com, you’ll now find an interactive and animated version of our organizational donor partisan analysis that allows you to filter by jurisdiction type and date range.

Filters

If you’d like to do further analysis, feel free to hit the Download button for a tab-delimited table of the charted data.  Note that for now we don’t display or download the complete donor dataset, as that includes over 8,000 organizations.

A few things become apparent when reviewing the results:

  • Some of the biggest legislative donors give heavily to candidates from both parties.
  • About 6% more is given to Democrats than Republicans in legislative races, but that increases to 28% when looking at statewide races.

Up next:  We’ll take a close look at hard money vs. soft money contributions.

TRC Map View

TRC includes a map view that shows you the voters as pins on a map. This is a standard view similar to what you’d see in any canvassing app. Since it runs directly in the browser, there’s no additional installation step needed.

The map view is exactly the same underlying information as in the List View, so you’re encouraged to use whichever view makes you most productive.  You can make changes in the map view, and then immediately switch to the List View and see them.

A common pattern is to use Geofencing to carve up a large region into smaller neighborhoods, and then you can use the map view to canvass those neighborhoods.

Using the map view

The pins are color coded by party ID. Hollow pins are doors that have already been visited. You can go back and edit answers on visited doors.

trc-map-1

You can touch a pin to see the voters at that household:

trc-map-2

If nobody is home, you can mark “Result Of Contact” for the door and move on. Else, you can select an individual to see their information and record the canvassing results.

Be sure to

  1. fill out the Party ID,
  2. fill out whether they’re a supporter, and
  3. result of contact.
  4. hit the “Save” button

trc-map-3

Getting to the map view

You can get to the map view by touching the “View Map” buttons on the standard walking list.

Offline usage

The map view leverages HTML5 local storage support to provide an offline experience even though it runs in a browser.

This means that you can load the map view while you have an internet connection, and then canvass offline, and then upload the results when you’re done. However, it’s highly encouraged to canvass with a cel connection so that your results are immediately uploaded. Even if you temporarily lose connectivity, your results will be uploaded when you regain a connection.

To verify your results are all uploaded, on the main page, touch “Local Storage” in the upper right corner. That will take you to a page like this:

Hit the refresh button to pull the current status. If you have outstanding changes and running offline, you’ll  see something like this:

trc-map-offline-1

Once you’re back online, hit the “Refresh” button again once online and verify the “Number of Changes not yet uploaded” is 0.

trc-map-offline-2


How to filter lists

TRC  has rich filter abilities that let you:

  1. Interactively explore your data.
  2. Determine a subset of targeted voters.
  3. Create a subsets that you can assign and share with others 
  4. Use your filtered view with any other feature in like printing, exporting a mail list, and maps.

Accessing the Filter plugin

There are several ways to access the filter ability:

1. You can access the Filter plugin directly from here.

2. You can access filtering via the standard list view on a sheet. Click the filter icon in the top-left view:

trc-filter-icon

3. You can also access Filter from the plugin list for your sheet.
Common things to filter on are:

  • History –   this is how likely somebody is to actually vote.
  • Party Id  – this is the party affiliation.
  • Answers to questions like Result of Contact or Supporter
  • Other microtargeting information.

Using the Basic View

There are several views for filtering.  The “basic” tab lets you qickly filter on History, PartyId, and Age.

filter_basic

Using the Query Builder view

You can also switch to the “Query Builder” tab to create a more complex query.

Here’s a basic query to look for ‘social’ equals ‘hard left’, ie, social liberals. You can select the column, operator, and value to create a rule, and then click “run query”:

filter_1

We can then build up the query to also require people over 55 years old. This is means “social liberal AND over 55”.
The “add rule” button adds a new rule to the current group. Note that we have ‘and’ selected which means both rules must apply.

filter_2

If we meant “social liberal OR over 55” , then we can select ‘or’:

filter_3_or

Tip: If you got 0 results, check that you didn’t confuse an ‘and’ with an ‘or’.  For example, (Party == 1 and Party == 2) will give you 0 results. It should be (Party == 1 or Party == 2)

We can add multiple rules. This means social liberals between 45 and 55. filter_4_and

We can also click “add group” to create more complex expressions. This means “Social liberal AND (party is either 3 OR 4)”. Using groups is needed when you want to combine AND with OR expressions.

filter_6_compose

The other trick is to us the ‘history’ score (likeliness to vote) to narrow the number of targets. You can see the “Previous Results” tab at the right shows the results of queries you’ve made so far. For example, this query finds fiscal conservatives that are very likely (0.90 is 90% ) likely to vote. Note that is must be specified as a decimal between 0…1 and include the leading 0. (so “0.90”, not “.90”, not “90%”).

filter_5_history

For example, this query is for any women with Party equal to 1 and that live in the specified zipcode or city.

filter_query

 In our case, it gives us 4900 voters. We can repeat the query with 0.70 instead, and gets 17000 voters. 

Tip: If you want more data, you can upload it yourself via the data uploader or purchase additional data from a data vendor like Voter-Science.


Saving the filter

Once you run your query, you can set it as the targets or save it as a regular sheet:

filter_save

The “Save Query” button will prompt you for a name for this filter. When you hit the back button to go back to the List View, you’ll see it on the sheet list. At this point, the filter acts just like any regular sheet, and you can share it, print it, or use it with any other plugin.

trc-after-filter

Click on “walking list” next to that filter, and you’re now viewing just within the filter.

You can click “share this” to share just this filter with another volunteer.

You can click “view entire walking list” to get back to the full list and possible create new filters.

Viewing on a map

You can also visualize a heat map for the results.  For example, here’s a query of “Who are supporters that haven’t voted yet”. You can then map it, and chase them down:

filter_7_map


Technical notes

Filtering creates a new “child” sheet that applies a filter-expression to extract a subset of the rows from the original (“parent”) sheet. The filter creates a a view that shares the same sandbox as the original sheet, so all changes in the child are instantly visible in the parent. However, the child sheet still maintains its own history tracking and audit logs.

TRC ListView

TRC’s default view is the “ListView”, which looks like a digital clipboard. Names are organized by street.   There are also other views, such as the common map view.

See http://bit.ly/1U1sgjJ  for a youtube demo.

The view looks like this:

trc-list-view

In the ListView, each row is a voter. Voters are grouped by address so that you can easily identify all voters at a single household when you’re at the door.  You can collapse voters by streets for easy managing.  The grouping is zebra striped (yellow /  white + grey) for easy-reading. The stripe color is purely ascetic.

When you edit cells, they start off red, and then turn green when they’re uploaded to the server.

trc-list-view-detailed

This provides immediate feedback on upload. Cells are colored red when you edit and green when their result is uploaded to the cloud, so you get immediate piece of mind that your changes are safely saved.

TRC supports collaborative editing: when multiple canvassers are walking the same precinct, other canvasser updates show up on your sheet in realtime.


Standard columns:

The default view in TRC includes some standard columns:

  • Voter address, name, age, gender – this is commonly from public Secretary of State Voter Database (VRDB)
  • History – this is a percentage of likeliness to vote in the upcoming election. This is similar to the “how many of the last  4 elections did they vote in”.  It’s computed via a predictive model and measurably more reliable than just a “4 score”.
  • Party – this is a party identification.
  • Supporter – Does the voter support your campaign? This likely correlates with party, but is very important in tracking cross-over voters and non-partisan races.
  • Comments – – this lets a canvasser provide free-form notes.

See Pinned vs. Floating values  for more details on where the data comes from.  

Targeted Voters

TRC will bold the “targeted” voters to help canvassers prioritize who to visit. For example, a precinct may have 500 people but you only have time to talk to 50 voters. The “targeting” helps prioritize which ones to talk to. TRC uses a default targeting algorithm, or you can supply your own targets, or you can coordinate with Voter-Science to use analytics to get a special target list for your campaign.

We continue to show all the voters because if you happen to talk to a non-targeted voter, we want to make it easy to record that information. (Knowing who the opponents are makes it easier to guess who our guys are).

Get-Out-The-Vote

Washington State is vote-by-mail. That means that people are casting their votes 3 weeks before the election. During these ballot chase periods, names will also be crossed off as people have voted.   Voter-Science collects the matchbacks from the county auditors.  See Prepping for the ‘16 General for more details.

Sharing with TRC

When you visit the homepage at https://canvas.voter-science.com, you must first log in, and then you’ll see a list of all sheets that you currently have access to.

You can gain access to a sheet by:

  1. Creating a new sheet yourself.
  2. When somebody shares a sheet with you (see below!)
  3. Entering a secret “canvass code” to grant you access to a sheet. This is a form of sharing.


Logging in to TRC 

You can log into TRC with an email address or via Facebook.  Anybody can log into TRC, but you may have an empty account until you gain access to some sheets!

Both the mobile applications and website use the same login mechanism.

Email login

If you log in with your email address,  TRC will email a temporary ‘pin’ to that address to confirm that it’s actually your address. You can enter that pin and complete the login.

Facebook login

Alternatively, you can log in with Facebook.

  1. It’s convenient. Nobody wants to remember yet another password.
  2. Facebook is a secure system and has advanced security features like two-factor-authentication.


Secret Links and Canvass Codes 


An existing user, such as a campaign manager, may share a secret link with you that has an embedded password (a “canvass code”) that will grant you access to a sheet:

They look like this:

https://canvas.voter-science.com/home/sheet?code=SECRET

Be careful! These secret links grant full permission!

The link will first force you to log in, and then grant the current user permission to the sheet. It will then redirect to the sheet’s url and you are ready to use the sheet.  After this, you’ll see the sheet on the homepage https://canvas.voter-science.com, so you should only need to use the secret link once to gain initial access.


Sharing sections of your sheet with new volunteers

Suppose you’re granted a code for an entire city with 10,000 voters.

You can share out individual precincts with volunteers. On the main screen, you’ll see a list of the precincts and a “share this” button:

trc-precinct-list


When you hit the “Share this…” button, you can enter an email address and short personal message.

trc-share-dialog


And then the volunteer will get an email with their own canvas code (just for their precinct) and their own url link. They can receive the email on their smartphone and open the app directly from there and be ready to go.

This code will be different than your original code. Unique codes let the system identify different users.

Best Practices

  1. Have canvassing volunteers use their personal email (and not a campaign-supplied email).  This is a security benefit: it provides a degree of accountability by not allowing them to be anonymous; and it provides better reporting to track per-user activity.  And if you do find out a canvasser was doing a bad job, you can see exactly the scope of what data they submitted – and even purge it if it was bad.  And you can revoke on a per-user basis.
  2. Don’t share the whole sheet; only share the minimal area that canvassers need –  This is the principal of “Least Privilege“.  So don’t share every precinct with every volunteer. Just share the precincts with the volunteers in those areas, and wait until they’re about to be active too.

FAQ

How to share the entire parent list? 

Go to the plugins menu and use the Share plugin.  This will let you share the entire list.


How do I “transfer” ownership from one account to another?

Suppose somebody shared a sheet with you using one email address (ie john@contoso.com), but you want to access it from another email address (ie, john@victory.com). In this case, you can just share the sheet with yourself to pass it from one email address to the other.  Log in with the account you have permission to, and then share it with your other email address.


I can’t find the a “share with” button

Sometimes this happens when trying to share top-level sheets or very large sheets that aren’t yet partitioned into children. In any case, you can also find the sharing from the Plugin gallery.

Who can I share with?

You could share a single precinct with multiple people and each would get their own unique code. This lets you identify each individual.

TRC does not charge per-user, so you are encouraged to share with as many people as you need.

Revoking codes

You can also revoke codes that you’ve shared out. For example, you may do this if you typed in the wrong email address.

Geek stuff

What a code is really doing is giving you access to a sandbox. You can share  a single sandbox with multiple people and use the per-user code to track which user is accessing the sandbox. By default, a legislative district split into precincts means that each precinct is a child sandbox.

Can I share URLs?

Yes, you can share browser URLs with anybody.  These URLs have a long number (a “sheet id”) that uniquely identifies the current sheet. For example:

https://canvas.voter-science.com/sheet/Index/e6f81e03af44436392ceaa909b5890cc

These urls are not secret. In other words, if user pastes this link into their browser, but does not have permission to the sheet, they will not be able to view the page.

In contrast, the secret canvas urls (which look like: https://canvas.voter-science.com/home/sheet?code=SECRET) , will grant permission to the current user, and then redirect (302) to a normal url with the sheet id.

If a secret URL is pasted in the browser, it will immediately do a permission check and then redirect (302) to a non-secret url. That ensures it’s safe to share urls you see in the browser.