Which legislators vote their district?

In light of the Senate passing SB 5082 to end advisory votes, I thought I’d highlight a personal project that shows their value even if they aren’t legally binding. Specifically, I wanted to make it easy for voters to determine how often their representatives in Olympia match their district on legislation that is referred to the ballot.

It’s codenamed Project Fidelity, and you can access it from my WhipStat site here:

https://whipstat.com/Projects/Fidelity

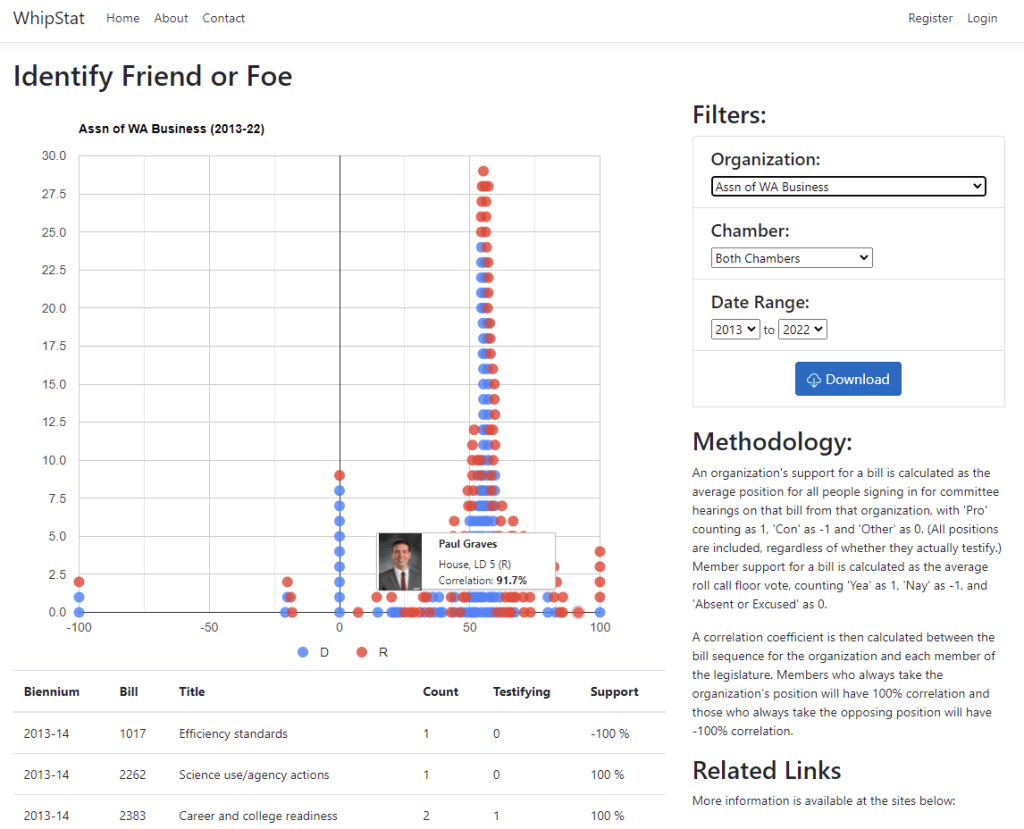
To create this I researched the LD breakdowns of all ballot measures since Initiative 960 went into effect in 2012.  Some of these were already posted on the WA Secretary of State website, but several years were missing and needed to be obtained via public records request.  I then compared them to voting records for all members using Legislative Web Services, something that I’d already been leveraging for the Partisan Leaderboard and Identify Friend or Foe projects.

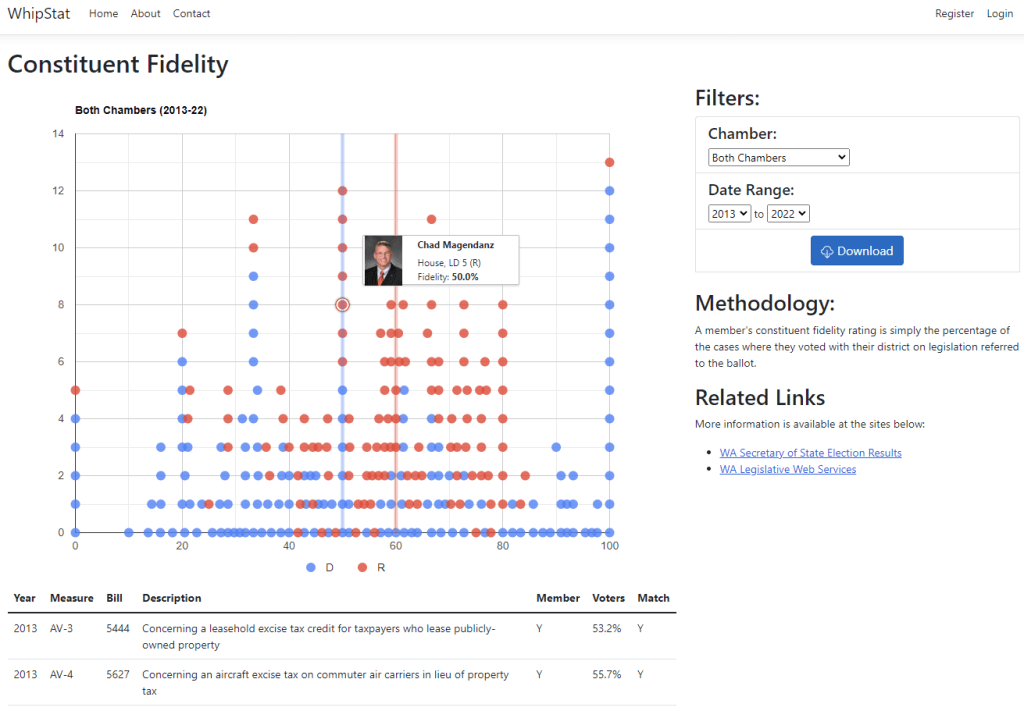
To use this tool, simply select the chamber and date range that interest you and a stacked scatter chart will be displayed on the left showing individual member fidelity scores, with 0% meaning that they never matched their district, and 100% meaning that they were always consistent with the majority of their constituents.  The data points (with tooltips) are color coded by party and you’ll also see vertical lines that represent the median score for each party.  Clicking an individual member in the chart will show a table below breaking down every bill that went before voters during their tenure, their last floor vote on the bill, the percentage of their constituents that supported it, and whether they matched.

If you click the Download button, it will create a tab-delimited file for each member on the chart and their score, allowing you to create an easy leaderboard in Excel for the best and worst members at voting their district.  (It’s also worth noting that the Republicans median score is 60%, compared to 50% for Democrats.  That might help explain why they seem so invested in ending advisory votes.)  One thing that surprised me is that members from swing districts aren’t very good at representing the majority of their constituents.  For example, I only got 50% of them right and I still had the best score of anyone representing the 5th LD.

We at Voter Science hope that Project Fidelity can provide a little more transparency into our state government, allowing WA taxpayers to easily determine which state legislators are voting with their district on legislation referred to the ballot, and which might be selling out to special interests or simply voting party line. It’s an opportunity to hold them more accountable for their voting record when they’re up for reelection, using a mechanism that was created with Initiative 960 and may soon be disappearing.

Introducing Fundraiser

The two most important metrics used to assess a campaign are doors and dollars. Your canvassing efforts prove your work ethic and ability to connect with voters face-to-face, and successful fundraising efforts reflect your support in the community and ultimately determine whether you’ll have the resources to run a formidable campaign. For most of our history at Voter Science, our ground game has been focused on Canvasser (codenamed TRC), a mobile app that helps you be more effective at the door, but today I’d like to introduce you to our new Fundraiser app (TRF).

You can download Fundraiser from the Apple Store or Google Play Store here:

At a high level, Fundraiser’s goals are simple:

  • Organize and target your fundraising lists
  • Integrate with latest public data for lobbyists and historical donors
  • Automatically provision and scale to any elected office
  • Expertly manage call logs from your smartphone

Here’s a quick slideshow of the app:

Usage

Like Canvasser, you can download Fundraiser from the app store for free and sign in without registering for an account or paying any subscription fee. All you need to do is provide an email address for us to send a PIN to verify your identity. Unlike Canvasser, however, you can create new call sheets immediately from within the mobile app by selecting New Sheet from the menu. Simply select the jurisdiction (local, legislative, judicial or statewide), office and district for your campaign from the drop-down lists and give your new call sheet a name. When you hit the Create button, a call sheet will be available within seconds based on historical donations to that district. Large lists will automatically be broken up into subdirectories to optimize for performance and reduce the footprint on your device.

Instead of creating a new call sheet from scratch, you may simply clone one of the examples like the GOP Lobby List. Any new call sheets that you create, clone or have shared with you will appear with a filled flag in the menu and allow write access to the call log, which is summarized on the Dashboard tab. The List tab shows the call prospects, sorted in the order you’ve selected in Settings. Prospects in the list are also color coded by propensity, which is based on the ratio that they’ve contributed to your party compared to others. Green prospects, contacts and organizations indicate they they’re likely friendly, whereas red ones might be less inclined to contribute.

While donors have been matched to public databases as well as paid lists of over 5 million records that include phone numbers and email addresses, lobbyist information is even more tightly integrated with public records from the PDC’s Open Data initiative. This not only includes names, addresses, phone numbers and email addresses, but also profile photos, bios, and up-to-date client lists. Contribution records from the PDC are also matched using our proprietary fuzzy matching algorithm against Voter Registration Database records going back to 2008 and the latest Corporations and Charities Filing System from the Secretary of State.

Finally, there’s a statewide Search feature built into the application that will allow you quickly review campaign contributions of any individual donor. This feature was added by popular request and is especially useful during filing week to determine just how partisan new candidates running for non-partisan positions really are.

Video Tutorial

The following video tutorial should help you get familiar with using Fundraiser:

Pricing

The mobile app itself and access to all public data is absolutely free. A subscription charge of just $100 per calendar year is required for access to paid phone numbers and email addresses. Currently, about half of donors in TRF include paid contact information, and with your support we’ll be purchasing additional lists to make that coverage more complete. In-app purchases will be enabled to subscribe directly from your phone soon, but until then please just contact us at info@voter-science.com for more information.

Identifying Friend or Foe

Given how often what’s said on the campaign trail bears so little resemblance to votes cast on the House or Senate floor, it’s become a full-time job holding our elected officials accountable. Stakeholder groups will spend hundreds of hours tracking bills and legislative voting records to generate candidate ratings every year, and some even pay professional lobbyists to provide those services. To what end? Simply to help identify friend or foe.

Voter Science has provided tools in the past to track bills of interest through the legislature, but we’ve found that the data entry required to tag bills that an organization supports or opposes can be a significant barrier to entry. Folks simply don’t have the time to maintain these lists because they’re too busy trying to work the halls of the state capitol and advocate for their positions with members one-on-one and in committee hearings. Fortunately, since 2014 we’ve had an online committee sign-in system for public hearings that’s a public record of positions that individuals and organizations have taken in support or opposition to every bill that’s been granted a hearing. In fact, at the beginning of the 2022 legislative session there were exactly 322,706 records from such public testimony. With this public data, we already know which bills that stakeholder groups have decided to support or oppose, so there’s really no need for any tedious data entry. Moreover, our state’s Legislative Web Services provide the public easy access to member voting records, so we can now automate the entire process of determining how those voting records correlate to each organization’s public policy position.

Today I’d like to introduce you to my latest pet project, codenamed Identify Friend or Foe (IFF) after the transponder system used by our military to identify combatants on the battlefield. You can access it from my WhipStat prototyping site here:

http://whipstat.com/Projects/Advocacy

The user interface is quite similar to my Partisan Leaderboard page, where I display a stack chart for all members by chamber and date range. However, here the main Organization drop-down lists over 1,500 lobbyist employers registered by the PDC that were referenced from hearing testimony records. When you select an organization, an aggregated list of “bills of interest” will be displayed beneath the chart. This table includes the bill number, title, total number of references from the selected organization, number willing to testify, and the percentage supporting the bill, with “Pro” counting as 1, “Con” as -1, and “Other as 0. Note that I’m using a fuzzy matching algorithm to match the organization name entered in committee sign-in to the official PDC records, so they may not be perfect…but we’re getting better every day. Use this list as a quick sanity check to ensure that your organization’s testimony records have been aggregated accurately.

The horizontal axis of the stack chart show shows the correlation between member voting records and organization position for each bill. Members who always vote the organization’s position will have 100% correlation and those who always take the opposite position will have -100% correlation. The dots for each member are color coded by party and if you hover over each you’ll see a tooltip with each members information and their actual correlation coefficient. To save a tab-delimited “leader list” of the member scores that can be imported into Excel, you can simply press the Download button.

Note that I’m currently collecting additional information that could potentially be used to further weight these scores (but that would make them less than a true Pearson correlation). Here are some examples:

  • A stakeholder’s willingness to testify or whether they’ve travelled from out of town
  • Committee votes made by members when advancing the bill to the floor
  • Committee leadership that could be positioned to advance or kill the bill

IFF is obviously a work in progress and we would welcome any feedback you have on our current user interface or algorithms. Since committee sign-in data now must be obtained by formal public records request, our plan is to update this tool at the end of every session, but if more frequent updates would be valuable to legislative advocacy groups we should encourage the Legislative Service Center (a.k.a. LegTech team) to incorporate the sign-in data into the Legislative Web Services, where it probably belongs.

We at Voter Science hope that IFF can usher in a new era of transparency for state government, freeing stakeholders and lobbyists from the tedious process of generating their own candidate rating systems and holding elected officials more accountable for their actual voting records when they inevitably come asking for campaign donations. It may seem obvious, but up until now it’s been surprisingly difficult to know who your friends in Olympia really are.

Case Study: Handling the MN GOP Convention

This article is a technical case-study for how Voter-Science’s services handled a high-traffic event: the Minnesota GOP State Convention on May 30th.  The MNGOP was clear that it was absolutely critical for the site to keep up with the surge in traffic and stay fully responsive during their event. The event was successful. There were surge periods hitting over 1000 requests/second to our servers, and the servers averaged responses in under 100ms.

Here were the engineering steps we took to provide the MNGOP that guarantee…

Continue reading “Case Study: Handling the MN GOP Convention”

A candidate’s first task: creating an online petition

As a new candidate, a great first task is to create an free online petition at https://PetitionBuilder.org and share it out.

An online petition lets you pick a topic and people can sign up with their name, zip code and email address. They can also leave comments and upvote on other comments – which is empowering to the signers.

An online petition is an opportunity to test the waters in March, not at the August primary.  Specifically:

  1. Pick a meaningful topic – Avoid frustrated partisan rhetoric that only appeals to the base. Choose something that resonate with their community and motivates voters.
  2. Get community feedback – If nobody signs your petition, it gives you a pulse that perhaps the topic is not broadly important and you should focus elsewhere. Signers can also leave comments and upvote on a petition, so that’s another signal you can use.
  3. Exercise your influencer network –To really get traction, you’re going to have to do more than just share it once on Facebook. Roll up your sleeves and go to community meetings, meet with other people, and be seen as a leader on the topic in the community. This is hard work, but all essential skills you will need on the campaign to get votes.

The bottom line is if you can’t even get 100 signatures on a petition, you certainly won’t get 10,000 votes in August!  For many, running an online petition is a great wakeup call – but early enough that they can do something about it.


Now what?

As you get your signatures, you can monitor the statistics page to see things like view rates, signup rates, share rates. You can even see a heat map of where the signups are coming from.

petition-stats

Some practical next steps after you get signatures:

  • Use screen shots from the stats pages to make followup posts promoting the petition.
  • Update your petition’s description with new information.
  • Use the stats to identify the biggest influences
  • Contact petition signers with followup messages and action items. You can import the signers into your own mail list or contact them via PetitionBuilder.
  • Match your signers back to the voter-database to determine other attributes such as legislative district, party score, voting history, or other demographics. Voter-Science can help with this.


Easy integration between your CRM and VS Canvasser

Voter-Science provides a free door-to-door canvassing app, and you can bring your own data and get started immediately at https://Start.Voter-Science.com

But for Developers, there’s also VoterScience API access that lets you can quickly add canvassing support to your existing app.

This is ideal for apps, such as CRMs or outreach platforms, that have a list of names. You can call an API to create a new canvassing sheet with those names, and then receive a webhook as the canvassing results are filled out. The general flow here would be:

  1. In your CRM app, add a button like “Export to Walklist” which takes a list from your app and passes it to the VS API. You’ll also specify a webhook to receive results and which users are allowed to access this sheet. Your app is then in full control of list management.
  2. Users can then open the walklist on the VS Canvasser app. They will log in via their email and are matched against permissions  you provided in the first step.
  3. As users fill in canvassing results, VS will fire the webhook you provided in the first API call.
  4. Your app listens on a webhook and fills in results in your system. This could be adding tags, filling in fields, etc.

See https://github.com/Voter-Science/TrcLibNpm/wiki/Create-New-Sheets  for API usage.

A few additional notes:

  • This can also be used to integrate with an existing CRM. For example, we use this APIs to integrate between VS Canvasser and NationBuilder.
  • Users for the canvassing can be separate from your CRM users. For example, you may have a few staff members that can access your CRM, but a totally separate field team for running canvassing.
  • The VoterScience system also has a powerful data mashup engine that can merge in additional data sets or even provide geocoding.

So stop writing your own canvass apps and focus on more interesting problems!

3 takeaways from WA Presidential Primary

Here are some key takeaways from the Washington State 2020 presidential primary yesterday.

Background

Voters were required to mark a party on their ballot and then Democrats could vote for the Democrat nominee (a race down to Biden vs. Bernie) while Republicans could vote for the Republican Nominee (Trump).

While everyone’s specific vote (ie, Biden vs. Bernie) is private, the list of who voted and their party preference on the ballot is public (Democrat vs. Republican) and maintained by the Secretary of State.

Results

As our snapshot last night (midnight at Mar 10th) , there were 1.8 million ballots received (about 37% of the total voters) with the following split:

WaPresPrimaryResults

[Source: Secretary of State March 10th Election Results.]

We expect the absolute numbers to change as more ballots are received in the mail; but the percentages and trends will likely stay similar.

96% of voters successfully marked a party preference. Leading up to Tuesday, there was some controversy about the need to mark a party preference, but in practice, the overwhelming majority complied.

Leveraging a party score database

Voter-Science maintains a Party Identification database that associates each voter with a Party ID score.  This database is used by hundreds of candidates across the state and has frequently predicted elections to 99%+ accuracy. (contact info@voter-science.com to learn more about our database).

We can then join the ballot results with the party scores to gain additional insights. Here’s the pivot showing both party score (rows) and ballot marking (columns).

WaPresPrimaryResultsByPartyScore

Voter-Science has a party score for over 90% of the voters.

  • A “hard” voter is that party’s base and likely to vote straight party line.
  • A “soft” voter likely identifies with a party but is still considered persuadable.
  • The “Unknown” row is people that VS doesn’t yet have a party score for.

For example, this reads that 1.1 million ballots were marked Democrats, and of that 544k of those voters have voter-science party score of “soft democrat”.  The boxes inline show the cross over votes.

Independents went 67.3% : 32.7%  for a Democrat ballot over a Republican one.  That could spell trouble for Republicans in November, or it may be because the Democrats still had an interesting choice on their ballot whereas Republicans just could vote for Trump.


What about cross-over voting?

Dedicated party voters stuck with their party ballot. Only 27k GOP and 10k democrats did cross over and vote on the other ballot.  The 10k democrat voters may seem significant, but that’s only 0.58% of the total votes – a small enough number to be attribute to voter error in filling out their ballot. This won’t be an issue in November once there’s just a single general ballot.

But, there’s interesting cross-over from Soft Dem/GOP:

76k soft democrats (8.3% of total Dems) voted on an uncontested GOP ballot to support Trump. That’s 5% of the total vote, which could be an interesting sector if Republicans can identify and leverage them in November.

20.3% of total GOP voters crossed over to vote on the democrat ballot. That could be because the GOP ballot has just Trump, so these GOP may have weighed in on the more interesting Bernie/Biden debate.


Summary

  • 96% of voters successfully marked a party preference
  • Independents went 67.3% : 32.7%  for a marked a Democrat ballot over a Republican one
  • 20.3% of total soft GOP voters crossed over to vote on the democrat ballot. Only 8% of total soft Democrats

Canvassing With Gestures

While the use of obscene gestures as part of any campaign communications strategy is to be discouraged, some gestures can be an intuitive and efficient means of data entry on mobile devices.  So as we knock on doors, anything that helps us shift focus from our phones to our neighbors not only saves time and effort, but also promotes a more positive image in our communities.

Canvasser has always supported the swipe gesture to proceed to the next household or household member, but with the release last week of v1.6 for both Android and iOS, we’ve introduced support for a powerful new gesture: Shake.

To enable this feature, simply open up Settings from the main menu.  The new Gestures section adds two new settings:

Screenshot_1563306118

The first setting assigns an action to be initiated when a shake gesture is detected.  This is disabled by default, but by tapping the control you can pick the option you’d like automatically entered into the Result field when your phone is shaken.  For canvassing, that’s usually “No contact” or “Left literature”, but “No answer” might be more appropriate if you’re on the phone working through a call list to remind people to vote.

The second setting is to provide audible feedback when an action is triggered by gesture, which is done using the built-in text-to-speech capabilities of your phone.  By default, this is enabled so that when you shake your phone you’ll immediately hear spoken feedback (e.g. “Left literature”) to indicate that the gesture was detected and Result field automatically filled.  You can then simply swipe to move on to the next household.

Note that the volume of the audible feedback will be subject to both the global and app-specific volume settings on your phone.  For more details on how to set these, click here for Android and here for iOS.

Shake gesture support will primarily be used from the household detail page, but with the v1.6.1 release we’ve added support for the voter detail page as well.

Of course, we’re just getting started with introducing more intuitive gestures to use with Canvasser that will help speed data entry when you’re out knocking on doors.  Personally, I’ve knocked on over 30,000 doors during my two last campaigns and so I have some opinions on what improves my efficiency, but I’m always anxious to hear more suggestions from the field.  If you have an idea for the next kick-ass new feature for Canvasser, please let me know at chad@voter-science.com.