A candidate’s first task: creating an online petition

As a new candidate, a great first task is to create an free online petition at https://PetitionBuilder.org and share it out.

An online petition lets you pick a topic and people can sign up with their name, zip code and email address. They can also leave comments and upvote on other comments – which is empowering to the signers.

An online petition is an opportunity to test the waters in March, not at the August primary.  Specifically:

  1. Pick a meaningful topic – Avoid frustrated partisan rhetoric that only appeals to the base. Choose something that resonate with their community and motivates voters.
  2. Get community feedback – If nobody signs your petition, it gives you a pulse that perhaps the topic is not broadly important and you should focus elsewhere. Signers can also leave comments and upvote on a petition, so that’s another signal you can use.
  3. Exercise your influencer network –To really get traction, you’re going to have to do more than just share it once on Facebook. Roll up your sleeves and go to community meetings, meet with other people, and be seen as a leader on the topic in the community. This is hard work, but all essential skills you will need on the campaign to get votes.

The bottom line is if you can’t even get 100 signatures on a petition, you certainly won’t get 10,000 votes in August!  For many, running an online petition is a great wakeup call – but early enough that they can do something about it.


Now what?

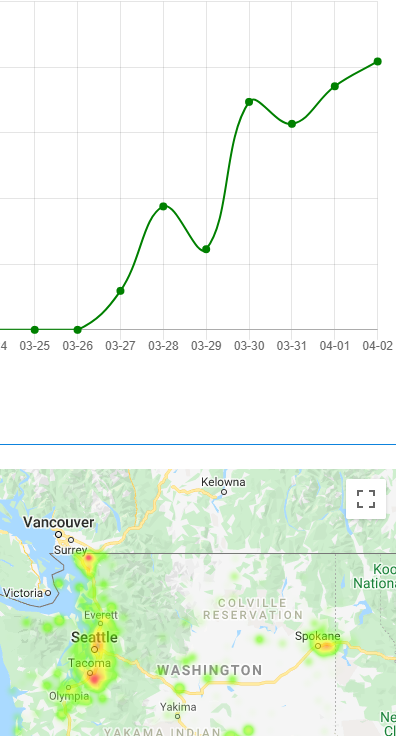
As you get your signatures, you can monitor the statistics page to see things like view rates, signup rates, share rates. You can even see a heat map of where the signups are coming from.

petition-stats

Some practical next steps after you get signatures:

  • Use screen shots from the stats pages to make followup posts promoting the petition.
  • Update your petition’s description with new information.
  • Use the stats to identify the biggest influences
  • Contact petition signers with followup messages and action items. You can import the signers into your own mail list or contact them via PetitionBuilder.
  • Match your signers back to the voter-database to determine other attributes such as legislative district, party score, voting history, or other demographics. Voter-Science can help with this.


Easy integration between your CRM and VS Canvasser

Voter-Science provides a free door-to-door canvassing app, and you can bring your own data and get started immediately at https://Start.Voter-Science.com

But for Developers, there’s also VoterScience API access that lets you can quickly add canvassing support to your existing app.

This is ideal for apps, such as CRMs or outreach platforms, that have a list of names. You can call an API to create a new canvassing sheet with those names, and then receive a webhook as the canvassing results are filled out. The general flow here would be:

  1. In your CRM app, add a button like “Export to Walklist” which takes a list from your app and passes it to the VS API. You’ll also specify a webhook to receive results and which users are allowed to access this sheet. Your app is then in full control of list management.
  2. Users can then open the walklist on the VS Canvasser app. They will log in via their email and are matched against permissions  you provided in the first step.
  3. As users fill in canvassing results, VS will fire the webhook you provided in the first API call.
  4. Your app listens on a webhook and fills in results in your system. This could be adding tags, filling in fields, etc.

See https://github.com/Voter-Science/TrcLibNpm/wiki/Create-New-Sheets  for API usage.

A few additional notes:

  • This can also be used to integrate with an existing CRM. For example, we use this APIs to integrate between VS Canvasser and NationBuilder.
  • Users for the canvassing can be separate from your CRM users. For example, you may have a few staff members that can access your CRM, but a totally separate field team for running canvassing.
  • The VoterScience system also has a powerful data mashup engine that can merge in additional data sets or even provide geocoding.

So stop writing your own canvass apps and focus on more interesting problems!

3 takeaways from WA Presidential Primary

Here are some key takeaways from the Washington State 2020 presidential primary yesterday.

Background

Voters were required to mark a party on their ballot and then Democrats could vote for the Democrat nominee (a race down to Biden vs. Bernie) while Republicans could vote for the Republican Nominee (Trump).

While everyone’s specific vote (ie, Biden vs. Bernie) is private, the list of who voted and their party preference on the ballot is public (Democrat vs. Republican) and maintained by the Secretary of State.

Results

As our snapshot last night (midnight at Mar 10th) , there were 1.8 million ballots received (about 37% of the total voters) with the following split:

WaPresPrimaryResults

[Source: Secretary of State March 10th Election Results.]

We expect the absolute numbers to change as more ballots are received in the mail; but the percentages and trends will likely stay similar.

96% of voters successfully marked a party preference. Leading up to Tuesday, there was some controversy about the need to mark a party preference, but in practice, the overwhelming majority complied.

Leveraging a party score database

Voter-Science maintains a Party Identification database that associates each voter with a Party ID score.  This database is used by hundreds of candidates across the state and has frequently predicted elections to 99%+ accuracy. (contact info@voter-science.com to learn more about our database).

We can then join the ballot results with the party scores to gain additional insights. Here’s the pivot showing both party score (rows) and ballot marking (columns).

WaPresPrimaryResultsByPartyScore

Voter-Science has a party score for over 90% of the voters.

  • A “hard” voter is that party’s base and likely to vote straight party line.
  • A “soft” voter likely identifies with a party but is still considered persuadable.
  • The “Unknown” row is people that VS doesn’t yet have a party score for.

For example, this reads that 1.1 million ballots were marked Democrats, and of that 544k of those voters have voter-science party score of “soft democrat”.  The boxes inline show the cross over votes.

Independents went 67.3% : 32.7%  for a Democrat ballot over a Republican one.  That could spell trouble for Republicans in November, or it may be because the Democrats still had an interesting choice on their ballot whereas Republicans just could vote for Trump.


What about cross-over voting?

Dedicated party voters stuck with their party ballot. Only 27k GOP and 10k democrats did cross over and vote on the other ballot.  The 10k democrat voters may seem significant, but that’s only 0.58% of the total votes – a small enough number to be attribute to voter error in filling out their ballot. This won’t be an issue in November once there’s just a single general ballot.

But, there’s interesting cross-over from Soft Dem/GOP:

76k soft democrats (8.3% of total Dems) voted on an uncontested GOP ballot to support Trump. That’s 5% of the total vote, which could be an interesting sector if Republicans can identify and leverage them in November.

20.3% of total GOP voters crossed over to vote on the democrat ballot. That could be because the GOP ballot has just Trump, so these GOP may have weighed in on the more interesting Bernie/Biden debate.


Summary

  • 96% of voters successfully marked a party preference
  • Independents went 67.3% : 32.7%  for a marked a Democrat ballot over a Republican one
  • 20.3% of total soft GOP voters crossed over to vote on the democrat ballot. Only 8% of total soft Democrats

Exporting to a CSV is almost always the wrong thing

In general, when somebody asks to download their TRC data as a CSV, it’s often the wrong thing.  Once you’ve exported to a CSV, you lose out on the benefits of TRC, including our mobile canvassing apps.  It also causes problems like a) how do you keep the downloaded CSV in current with changes; b) how do ensure data collected from that CSV gets uploaded back to your account? And usually there’s a better way to accomplish their scenario…

Continue reading “Exporting to a CSV is almost always the wrong thing”

Comparing Precinct Results across Boundary Changes

While your individual vote is private, the aggregate vote of from your precinct (ie, neighborhood) is public. Campaigns often look at these precincts level results to answer questions like “How did the President do in my district?” and “How did this Initiative correlate with that candidate?”.

Merging precinct results from different races together to get these insights can be valuable – but only if the merge is done correctly! But what happens when you need to merge precinct results across different years and the precinct boundaries have changed? This is particularly significant when comparing precinct results from 2010 (before redistricting).

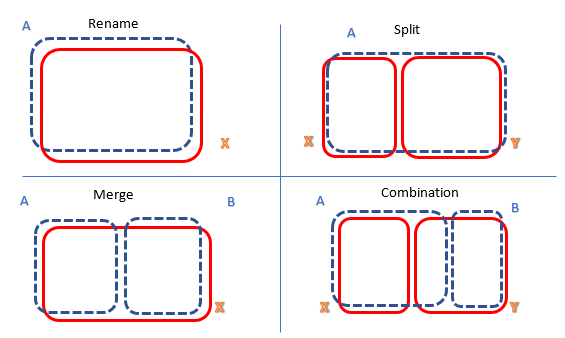
Here are several examples of precinct changes, going from an old (dotted blue line) to a new (solid red line) boundary.

BoundaryChanges

  • Rename – The precinct gets renamed from “A” to “X”, but covers the same area.
  • Split – The precinct gets split into 2 smaller precincts. “A” gets split into “X” and “Y”
  • Merge – Two smaller precincts get merged into a larger precinct. “A” and “B” get merged into “X”
  • Combination – a combination of the above, representing a potentially arbitrarily complex transformation.

Your precinct may even have kept the same name but still significantly changed boundaries! A precinct from 2010 and another from 2018 could have the same name, but refer to totally different voters or neighborhoods.

So naively, if you just measure results from old and new precincts, you could get a complete mixup.

Measure it!

We measured how much WA state 2018 precincts had changed since 2018 (before redistricting). We call this the “decay rate” (see VRDB decay rate).

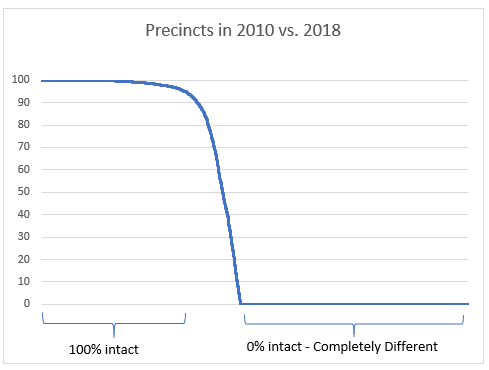
Each point on the chart below represents how “intact” a 2010 precinct is compared to the same precinct name in 2018. Precincts that are 100% intact are stable and haven’t changed – those results can be merged safely by name. This chart shows the portion of precincts that stayed the same vs. changed.

PrecinctDecay2010-2018

In fact, it turns out over a third of the precincts were totally intact from 2010. But half were completely different! Merging precincts from that half could give completely random results. What’s interesting is how clustered the results were: over 80% of precincts are either nearly unchanged or completely changed. So this is a highly localized phenomena: some areas may not see it at all (and hence not even realize it exists), whereas other areas may be heavily impacted.

What can we do?

The good news is that once we recognize this, we can actually do geo spatial comparisons to map the old precincts into the new ones. This creates a transform that lets us compare precinct results across different boundaries.

The Data Lifecycle

This article describes a best-practice for campaigns in using data for targeting voters and how you can achieve that with TRC.

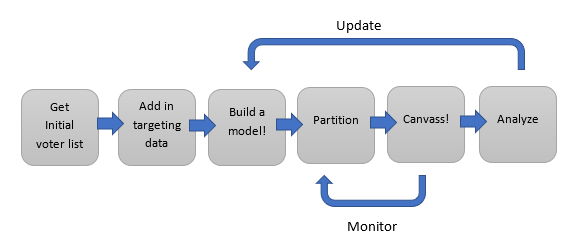
The flow here is to start with getting initial public data from the county auditor, merge in microtargeting information, choose the targets, canvass, and iterate on the model.

flowchart

Conceptually, we can think of data like a giant spreadsheet (CSV file). Each row is a voter, and columns are information about that voter.  We’ll walk through the different phases with a small sample of 8 records, but TRC can help you do this with your entire district of 80,000 records

Continue reading “The Data Lifecycle”

Is Washington State Gerrymandered?

“Gerrymandering” is manipulating political boundaries to favor a party. Wikipedia has an excellent summary and examples of the concept:
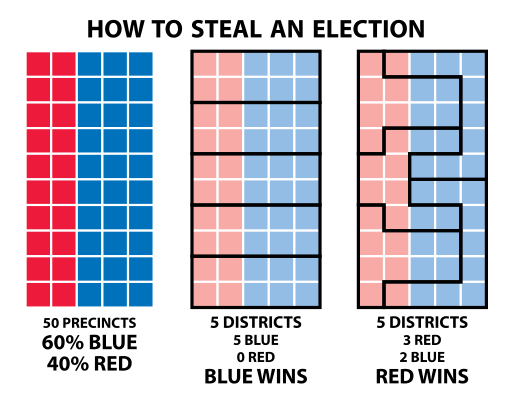
How to Steal an Election - Gerrymandering

We’ll take a purely data-driven approach to measure if Washington State’s legislative districts are gerrymandered. While there is no absolute mathematical definition for gerrymandering – and therefore no definitive test – there are good objective statistical tests to measure anomalies.

This article focuses on applying these approaches to the legislative boundaries in WA state.

  1. First, we’ll look at the actual election results and see if there’s anything suspicious on the surface.
  2. Then we’ll run a standard statistical test – the McGhee test developed at the University of Chicago.
  3. And then we’ll run some generic algorithms to produce actually gerrymandered maps and compare to actual results.

To simplify nomenclature throughout this analysis, we’ll provide summary from the GOP perspective. The results can all be directly flipped to switch to the Democrat perspective. (IE, almost always, a x% GOP result means a (100-x)% Democrat result).

To simplify nomenclature, we’ll look at results from the GOP There’s no definitive criteria for creating district boundaries. Districts must be contiguous and similar in population. However, even these criteria are tricky. For example, a district boundary is set for 10 years, so as population grows and shifts over time, districts’ populations may shift. Districts can’t be simple shapes like hexagons because they may need to account for geographic boundaries or roads.

Here is a map of legislative boundaries. Since districts are population based (and not based on square-miles), one can see the districts are more concentrated in dense population centers.
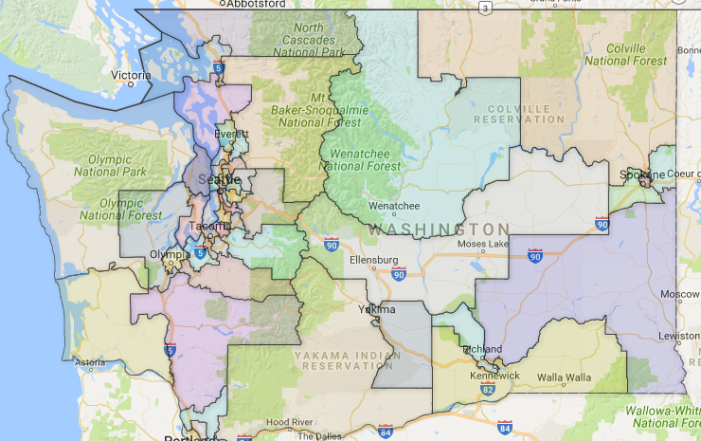
WA Leg Districts 2016

[1] Looking at actual election results

WA has 49 legislative districts, and each district has 2 house members and 1 senate member.

As of the last statewide legislative election in Nov ‘16, in the senate, the GOP / Democrat split was 24-25. In the house, the GOP/ Democrats split was 48- 50. Roughly 90% of the 49 districts have all three members from the same party, indicating that individual districts carry a definitive partisan bias. But when tallying up all the legislative races, the overall split is almost evenly divided between parties in both the house and senate caucus.

Here’s how the GOP results in the legislative caucuses compares to their 2016 statewide results between a Democrat and Republican candidate. [ Source: WA Secretary of State] :

GOP Candidate Percent Vote
2016 Secretary of State (Wyman) 54.74%
2016 GOP House 48.98%
2016 GOP Senate 48.98%
2012, Governor (McKenna) 48.50%
2016 Auditor (Miloscia) 47.69%
2016 Public Lands (McLaughlin) 46.84%
2016 Governor (Bryant) 45.61%
2016 Lt. Governor (McClendon) 45.61%
2016 Insurance Commissioner (Schrock) 41.66%
2016 Senate (Vance) 40.99%
2016 President (Trump) 38.07%

So clearly the Republicans have done a better job in the legislature than at most statewide races. Only Kim Wyman has outperformed the caucuses.

Some may suggest gerrymandering as the only way that the Republican caucuses could outperform statewide races. But a statewide race requires a single candidate to appeal to all 49 districts. Whereas legislative districts have a different candidate per district, allowing each candidate to vary to “fit the district”.

The real test of boundaries is to focus on a single partisan candidate and compare what percent of legislative districts they’d “win” to their statewide percentage.  For example, Trump got 38.07% of the statewide vote. He also won 19 / 49 legislative districts, which is 38.78% – nearly the same ratio that he had statewide. That is a strong indicator that the districts aren’t gerrymandered.

We can see the results from other partisan statewide candidates:

GOP Candidate % of Statewide vote % of Districts won
2016 Secretary of State (Wyman) 54.74% 78%
2016 Auditor (Miloscia) 47.69% 53%
2016 Public Lands (McLaughlin) 46.84% 47%
2016 Governor (Bryant) 45.61% 47%
2016 Lt. Governor (McClendon) 45.61% 45%
2016 President (Trump) 38.07% 39%
2016 Insurance Commissioner (Schrock) 41.66% 33%
2016 Senate (Vance) 40.99% 27%

This analysis is looking at a broad range of races across a 15% spread. If the districts were actually gerrymandered, we’d expect that GOP candidates consistently performed better (or from the Democrat’s perspective, worse) in ‘% of district won’ than by ‘% of statewide vote’. But they do not. There’s an almost linear correlation between these results (R2=.83). Candidates that won more statewide votes also won more individual districts. Some GOP candidates benefit from the legislative boundaries, some performed worse.

[2] Bring out the math – running the statistical tests

The mathematical test we’ll run is the McGhee test, developed by Eric McGhee from University of Chicago. “Wired” explains “In that paper, they proposed a simple measure of partisan symmetry, called the “efficiency gap,” which tries to capture just what it is that gerrymandering does. At its core, gerrymandering is about wasting your opponent’s votes: packing them where they aren’t needed and spreading them where they can’t win.”

The test defines a “wasted vote” as any vote that does not directly contribute to a victory. If you win a district, any vote past 50% is considered wasted (it wasn’t necessary to win); if you lose a district, all of the votes were wasted. Practically, this means:

  • Unless you win a district with exactly 50%+ 1 votes, there are at least some “wasted” votes.
  • large blowout victories and 49.9% “close calls” produce the most “wasted” votes.

It then defines an “efficiency gap” as the (difference in each party’s wasted vote divided by the total vote). There is no definitive threshold for the efficiency gap that defines gerrymandering, but McGhee calculated the average efficiency gap in 2012 was 6%, and the egregious gerrymandering examples have are over 10%.
We apply the McGhee test on the 2016 presidential race across the legislative districts using election data from the Secretary of State:

GOP Candidate Percent Vote Egap
2016 Secretary of State (Wyman) 54.74% -16.3%
2016 Auditor (Miloscia) 47.69% -6.3%
2016 Public Lands (McLaughlin) 46.84% -2.1%
2016 Lt. Governor (McClendon) 45.61% -2.2%
2016 Governor (Bryant) 45.61% -4.5%
2016 Insurance Commissioner (Schrock) 41.66% 2.6%
2016 Senate (Vance) 40.99% 6.8%
2016 President (Trump) 38.07% -3.7%

The average gap from this spectrum of WA races is 3.2%, well below the national average. So our statistical test suggest that the districts are not gerrymandered.

[3] What would gerrymandering look like?

A final approach we take is to work backwards: we can deliberately produce gerrymandered maps and compare them to the actual map.
Here, we use a genetic algorithm, which starts with an initial configuration and then mutates it over a series of iterations as it “evolves” towards a goal. Mutations must preserve certain rules like contiguous boundaries. In this case, the goal was to maximize the number of GOP legislative victories, where victories where calculated using a Monte Carlo simulation driven by previous election turnout results from record poor GOP years. We used election results that initially gave GOP only 21 of the 49 districts – simulating a “worst case scenario” for GOP that put them near their historical lows. After series of genetic mutations, the final result was a map with 26 of 49 GOP wins – a pickup of 5 seats. The chart here shows the evolution progressing along the top.

Generic Algorithms Gerrymandering

However, we notice that the boundaries here definitely look suspicious. They’re clearly warped and have unnatural borders designed to carve out an advantage.
What this also shows is that truly gerrymandered results could produce a significant GOP advantage – even in a year with record poor Republican voter turnout.

In conclusion

To summarize:

  1. The legislative results are within proximity of the statewide governor results. And when measured across a wide range of candidates, there is no consistent advantage from district boundaries over a pure statewide vote.
  2. The house and senate GOP caucus performances do perform exceptionally well – particularly compared to the statewide performance of most GOP candidates. But this appears to be more due to the caucuses picking candidates to fit their district rather than gerrymandering.
  3. If we deliberately create theoretical gerrymandered districts via computer simulation, the potential GOP advantage would be significantly higher than what we witness.

In the absence of any contradicting evidence, we would conclude that WA state’s legislative boundaries are fairly drawn and not gerrymandered.
LD 45 Turnout Statistics

The special election for the 45th district senate seat is Nov 7th 2017, just a few days away. Here are some statistics based on the ballot returns reported by the Secretary of State.

 The district is about 92,000 voters. Overall turnout as of Nov 4th is 21.3%. This is the highest turnout for an election district over 30,000 voters.

King County turnout  overall is 15.4%.  For comparison to other off-year legislative elections, Teri Hickel’s ’15 special election was 35%.


There has been significant new voter registration in the district since Andy Hill’s ’14 election victory. Here is a breakdown registration date:

% of district … registered since…
2% Since ’17 Primary
6% Within last year
21% Since Nov ’14

It’s a predominantly Democrat district.  In ‘14 and ’16 house races, Democrat’s average victory in LD 45 has been around 58%.  The district also voted over a 2:1 for Hillary Clinton over Donald Trump. Kim Wyman and Andy Hill are the only Republicans to have won this district.

The SOS does not report on the actual ballot results until election night, but we can use the Voter-Science party id database [1] to see how results are looking prior to election day.

 Here is a heat map of Democrat turnout (left) vs. GOP turnout (right) in the 45th :

LD45Tunrout-Nov4th2017

Of Voters identified as GOP, 28% have voted. Of voters identified as Democrats, 23% have voted.  Of voters identified as Independents, only 14% have voted.  So while the democrats may have raw volume of numbers, the GOP has driven higher turnout amongst their base.  

 [1] The Voter-Science party ID database has a party ID for 87% of the individuals in the 45th district and has accurately predicted all 45th races within 98.5% accuracy since 2015.

Why should you save your data back to the cloud

A major benefit of a mobile canvassing app is that your work is automatically recorded. However,  it’s common for people to export their data to another system and work off that; or print out their lists and work off a printed walk list. In those cases, be sure to update your data in TRC afterwards! When using paper lists, here’s why it’s worth the extra effort to save your results back to TRC:


1. Ensure your data is saved and secure

Paper can get lost or stolen.  Whereas data in TRC is safe and secure. It’s saved on the cloud and TRC’s sandbox model guarantees that your data will never get accidentally overwritten.

2. Easy sharing with other campaigns

Once your data is in TRC, it’s easy to conditionally share portions of it with other campaigns. For example, suppose you’re running for a city council race which overlaps another schoolboard race. TRC can automatically figure out just the overlapping records and just share those. That analysis is hard to do with paper.

Furthermore, suppose you’re canvassing team is asking three separate questions and you only want to share results from one of the questions. Again, once your data is in TRC, you can easily do that controlled granular sharing.

3. Make sure you don’t double-contact the same people.

Updating the data on the server ensures your campaign doesn’t accidentally contact the same person multiple times, especially when you have multiple canvassers operating independently.  Accidentally contacting the same people multiple times would be wasting resources and could also be perceived as harassment.

4. Enables searching for patterns and identifying new supporters

Knowing your specific supporters lets us run predictive analytics to identify other potential supporters.  For example, suppose your district has 50,000 voters. If your canvassing activity identities 200 supporters and another 100 non-supporters, we can then use analytics to search for patterns. Perhaps you’re doing well among certain issues, we can then use predictive analytics to find new likely supporters that are also interested in those issues. That can further refine your target.

5. Get GOTV reporting

TRC provides campaign-wide reports for Get-out-the-vote and election predictions. In 2016, these reports were frequently 99% accurate for legislative district races. The more data you provide back to TRC, the more accurate predictions and reports it can provide back you.