TRC Map View

TRC includes a map view that shows you the voters as pins on a map. This is a standard view similar to what you’d see in any canvassing app. Since it runs directly in the browser, there’s no additional installation step needed.

The map view is exactly the same underlying information as in the List View, so you’re encouraged to use whichever view makes you most productive.  You can make changes in the map view, and then immediately switch to the List View and see them.

A common pattern is to use Geofencing to carve up a large region into smaller neighborhoods, and then you can use the map view to canvass those neighborhoods.

Using the map view

The pins are color coded by party ID. Hollow pins are doors that have already been visited. You can go back and edit answers on visited doors.

trc-map-1

You can touch a pin to see the voters at that household:

trc-map-2

If nobody is home, you can mark “Result Of Contact” for the door and move on. Else, you can select an individual to see their information and record the canvassing results.

Be sure to

  1. fill out the Party ID,
  2. fill out whether they’re a supporter, and
  3. result of contact.
  4. hit the “Save” button

trc-map-3

Getting to the map view

You can get to the map view by touching the “View Map” buttons on the standard walking list.

Offline usage

The map view leverages HTML5 local storage support to provide an offline experience even though it runs in a browser.

This means that you can load the map view while you have an internet connection, and then canvass offline, and then upload the results when you’re done. However, it’s highly encouraged to canvass with a cel connection so that your results are immediately uploaded. Even if you temporarily lose connectivity, your results will be uploaded when you regain a connection.

To verify your results are all uploaded, on the main page, touch “Local Storage” in the upper right corner. That will take you to a page like this:

Hit the refresh button to pull the current status. If you have outstanding changes and running offline, you’ll  see something like this:

trc-map-offline-1

Once you’re back online, hit the “Refresh” button again once online and verify the “Number of Changes not yet uploaded” is 0.

trc-map-offline-2


How to filter lists

TRC  has rich filter abilities that let you:

  1. Interactively explore your data.
  2. Determine a subset of targeted voters.
  3. Create a subsets that you can assign and share with others 
  4. Use your filtered view with any other feature in like printing, exporting a mail list, and maps.

Accessing the Filter plugin

There are several ways to access the filter ability:

1. You can access the Filter plugin directly from here.

2. You can access filtering via the standard list view on a sheet. Click the filter icon in the top-left view:

trc-filter-icon

3. You can also access Filter from the plugin list for your sheet.
Common things to filter on are:

  • History –   this is how likely somebody is to actually vote.
  • Party Id  – this is the party affiliation.
  • Answers to questions like Result of Contact or Supporter
  • Other microtargeting information.

Using the Basic View

There are several views for filtering.  The “basic” tab lets you qickly filter on History, PartyId, and Age.

filter_basic

Using the Query Builder view

You can also switch to the “Query Builder” tab to create a more complex query.

Here’s a basic query to look for ‘social’ equals ‘hard left’, ie, social liberals. You can select the column, operator, and value to create a rule, and then click “run query”:

filter_1

We can then build up the query to also require people over 55 years old. This is means “social liberal AND over 55”.
The “add rule” button adds a new rule to the current group. Note that we have ‘and’ selected which means both rules must apply.

filter_2

If we meant “social liberal OR over 55” , then we can select ‘or’:

filter_3_or

Tip: If you got 0 results, check that you didn’t confuse an ‘and’ with an ‘or’.  For example, (Party == 1 and Party == 2) will give you 0 results. It should be (Party == 1 or Party == 2)

We can add multiple rules. This means social liberals between 45 and 55. filter_4_and

We can also click “add group” to create more complex expressions. This means “Social liberal AND (party is either 3 OR 4)”. Using groups is needed when you want to combine AND with OR expressions.

filter_6_compose

The other trick is to us the ‘history’ score (likeliness to vote) to narrow the number of targets. You can see the “Previous Results” tab at the right shows the results of queries you’ve made so far. For example, this query finds fiscal conservatives that are very likely (0.90 is 90% ) likely to vote. Note that is must be specified as a decimal between 0…1 and include the leading 0. (so “0.90”, not “.90”, not “90%”).

filter_5_history

For example, this query is for any women with Party equal to 1 and that live in the specified zipcode or city.

filter_query

 In our case, it gives us 4900 voters. We can repeat the query with 0.70 instead, and gets 17000 voters. 

Tip: If you want more data, you can upload it yourself via the data uploader or purchase additional data from a data vendor like Voter-Science.


Saving the filter

Once you run your query, you can set it as the targets or save it as a regular sheet:

filter_save

The “Save Query” button will prompt you for a name for this filter. When you hit the back button to go back to the List View, you’ll see it on the sheet list. At this point, the filter acts just like any regular sheet, and you can share it, print it, or use it with any other plugin.

trc-after-filter

Click on “walking list” next to that filter, and you’re now viewing just within the filter.

You can click “share this” to share just this filter with another volunteer.

You can click “view entire walking list” to get back to the full list and possible create new filters.

Viewing on a map

You can also visualize a heat map for the results.  For example, here’s a query of “Who are supporters that haven’t voted yet”. You can then map it, and chase them down:

filter_7_map


Technical notes

Filtering creates a new “child” sheet that applies a filter-expression to extract a subset of the rows from the original (“parent”) sheet. The filter creates a a view that shares the same sandbox as the original sheet, so all changes in the child are instantly visible in the parent. However, the child sheet still maintains its own history tracking and audit logs.

The TRC Sandbox

The TRC canvassing app is sitting in front of a powerful general-purpose service for sharing tabular data files like CSVs.

This provides:

  1. Integrations – a means to two-way sync that tabular data with external data sources (like NationBuilder, Salesforce, Google sheets, dropbox, etc)
  2. User-management – you can share out a sheet with users, track per-user activity, and revoke permissions.
  3. Source Control – TRC provides both branching and full history tracking. Branching means you can create a “child” sheet that has a subset view of the “parent” sheet. Full history tracking means you can track every change.
  4. A compute engine – TRC has a general compute fabric for process joins, merges, and aggregations on your data.

Sandbox and Isolation

Each campaign gets its own isolated view of the data, which we call a “sandbox”.  This means that two candidates can running against each other for the same position against each other in a primary,

Sandboxes can then be further partitioned among your volunteers.

trc-overview

For example, R1…R5 are individual records.   User U1 is synchronizing the data with some external data source, such as NationBuilder or Salesforce.  S1 refers to U1’s sandbox.

U1 then shares out subsets of the sheet with volunteers on the campaign.  This creates a new sandbox S2 for User U2, which has access to rows R3,R4. And another new sandbox, S3, for users U5,U6,U7 which get access to R1 and R2.  Since U5,U6, U7 are in the same sandbox (S3), they can see each other’s changes.

The system is a distributed hierarchy, so any operation U1 can do in S1; U2 can do in S2. U2 is fully empowered within their sandbox! So U2 can divide their own sandbox and create a new sandbox for U3 and U4 to each edit R4.  Since U3 and U4 each have their own sandbox (in contrast to U5,U6,U7 who all share a sandbox),  U3 and U4 can edit the same record without conflicting with each other.   Their parent (U2) can then resolve any conflict.

This has several benefits:

  1. It allows multiple candidates to run against each other in a primary. They each get their own sandbox.
  2. Within a sandbox, it ensures that your data is never overwritten.
  3. It allows an untrusted people to submit data to your campaign. The data is just quarantined in its own sandbox and not integrated until proven safe.
  4. The full audit log allows purging bad data even after an integration.

TRC ListView

TRC’s default view is the “ListView”, which looks like a digital clipboard. Names are organized by street.   There are also other views, such as the common map view.

See http://bit.ly/1U1sgjJ  for a youtube demo.

The view looks like this:

trc-list-view

In the ListView, each row is a voter. Voters are grouped by address so that you can easily identify all voters at a single household when you’re at the door.  You can collapse voters by streets for easy managing.  The grouping is zebra striped (yellow /  white + grey) for easy-reading. The stripe color is purely ascetic.

When you edit cells, they start off red, and then turn green when they’re uploaded to the server.

trc-list-view-detailed

This provides immediate feedback on upload. Cells are colored red when you edit and green when their result is uploaded to the cloud, so you get immediate piece of mind that your changes are safely saved.

TRC supports collaborative editing: when multiple canvassers are walking the same precinct, other canvasser updates show up on your sheet in realtime.


Standard columns:

The default view in TRC includes some standard columns:

  • Voter address, name, age, gender – this is commonly from public Secretary of State Voter Database (VRDB)
  • History – this is a percentage of likeliness to vote in the upcoming election. This is similar to the “how many of the last  4 elections did they vote in”.  It’s computed via a predictive model and measurably more reliable than just a “4 score”.
  • Party – this is a party identification.
  • Supporter – Does the voter support your campaign? This likely correlates with party, but is very important in tracking cross-over voters and non-partisan races.
  • Comments – – this lets a canvasser provide free-form notes.

See Pinned vs. Floating values  for more details on where the data comes from.  

Targeted Voters

TRC will bold the “targeted” voters to help canvassers prioritize who to visit. For example, a precinct may have 500 people but you only have time to talk to 50 voters. The “targeting” helps prioritize which ones to talk to. TRC uses a default targeting algorithm, or you can supply your own targets, or you can coordinate with Voter-Science to use analytics to get a special target list for your campaign.

We continue to show all the voters because if you happen to talk to a non-targeted voter, we want to make it easy to record that information. (Knowing who the opponents are makes it easier to guess who our guys are).

Get-Out-The-Vote

Washington State is vote-by-mail. That means that people are casting their votes 3 weeks before the election. During these ballot chase periods, names will also be crossed off as people have voted.   Voter-Science collects the matchbacks from the county auditors.  See Prepping for the ‘16 General for more details.

Sharing with TRC

When you visit the homepage at https://canvas.voter-science.com, you must first log in, and then you’ll see a list of all sheets that you currently have access to.

You can gain access to a sheet by:

  1. Creating a new sheet yourself.
  2. When somebody shares a sheet with you (see below!)
  3. Entering a secret “canvass code” to grant you access to a sheet. This is a form of sharing.


Logging in to TRC 

You can log into TRC with an email address or via Facebook.  Anybody can log into TRC, but you may have an empty account until you gain access to some sheets!

Both the mobile applications and website use the same login mechanism.

Email login

If you log in with your email address,  TRC will email a temporary ‘pin’ to that address to confirm that it’s actually your address. You can enter that pin and complete the login.

Facebook login

Alternatively, you can log in with Facebook.

  1. It’s convenient. Nobody wants to remember yet another password.
  2. Facebook is a secure system and has advanced security features like two-factor-authentication.


Secret Links and Canvass Codes 


An existing user, such as a campaign manager, may share a secret link with you that has an embedded password (a “canvass code”) that will grant you access to a sheet:

They look like this:

https://canvas.voter-science.com/home/sheet?code=SECRET

Be careful! These secret links grant full permission!

The link will first force you to log in, and then grant the current user permission to the sheet. It will then redirect to the sheet’s url and you are ready to use the sheet.  After this, you’ll see the sheet on the homepage https://canvas.voter-science.com, so you should only need to use the secret link once to gain initial access.


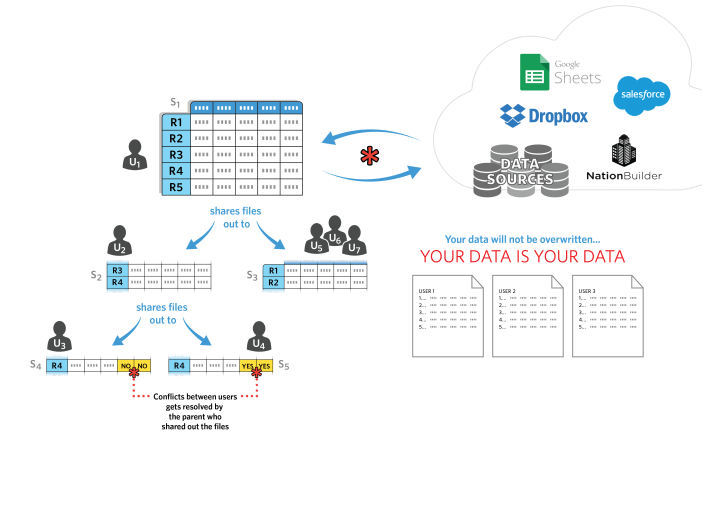
Sharing sections of your sheet with new volunteers

Suppose you’re granted a code for an entire city with 10,000 voters.

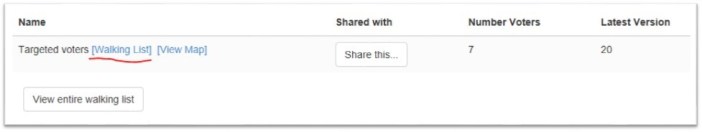
You can share out individual precincts with volunteers. On the main screen, you’ll see a list of the precincts and a “share this” button:

trc-precinct-list


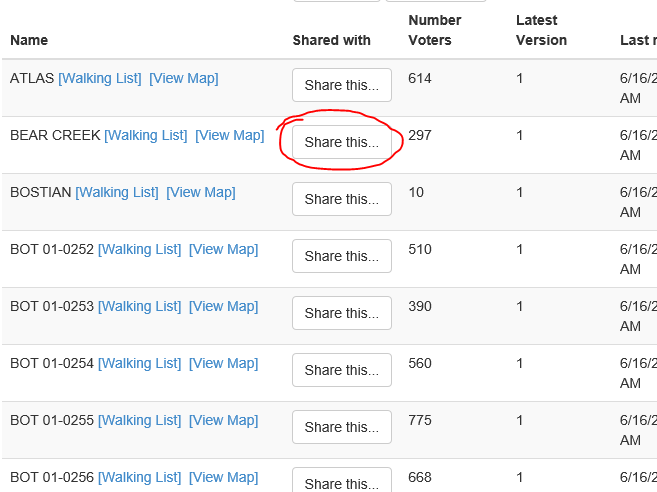
When you hit the “Share this…” button, you can enter an email address and short personal message.

trc-share-dialog


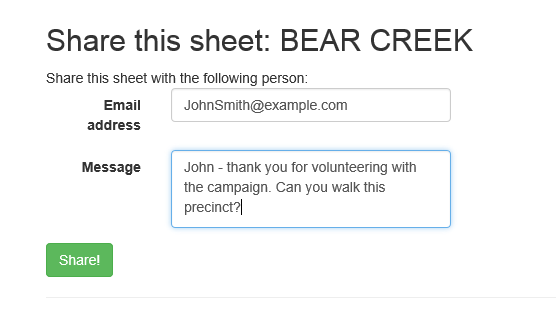
And then the volunteer will get an email with their own canvas code (just for their precinct) and their own url link. They can receive the email on their smartphone and open the app directly from there and be ready to go.

This code will be different than your original code. Unique codes let the system identify different users.

Best Practices

  1. Have canvassing volunteers use their personal email (and not a campaign-supplied email).  This is a security benefit: it provides a degree of accountability by not allowing them to be anonymous; and it provides better reporting to track per-user activity.  And if you do find out a canvasser was doing a bad job, you can see exactly the scope of what data they submitted – and even purge it if it was bad.  And you can revoke on a per-user basis.
  2. Don’t share the whole sheet; only share the minimal area that canvassers need –  This is the principal of “Least Privilege“.  So don’t share every precinct with every volunteer. Just share the precincts with the volunteers in those areas, and wait until they’re about to be active too.

FAQ

How to share the entire parent list? 

Go to the plugins menu and use the Share plugin.  This will let you share the entire list.


How do I “transfer” ownership from one account to another?

Suppose somebody shared a sheet with you using one email address (ie john@contoso.com), but you want to access it from another email address (ie, john@victory.com). In this case, you can just share the sheet with yourself to pass it from one email address to the other.  Log in with the account you have permission to, and then share it with your other email address.


I can’t find the a “share with” button

Sometimes this happens when trying to share top-level sheets or very large sheets that aren’t yet partitioned into children. In any case, you can also find the sharing from the Plugin gallery.

Who can I share with?

You could share a single precinct with multiple people and each would get their own unique code. This lets you identify each individual.

TRC does not charge per-user, so you are encouraged to share with as many people as you need.

Revoking codes

You can also revoke codes that you’ve shared out. For example, you may do this if you typed in the wrong email address.

Geek stuff

What a code is really doing is giving you access to a sandbox. You can share  a single sandbox with multiple people and use the per-user code to track which user is accessing the sandbox. By default, a legislative district split into precincts means that each precinct is a child sandbox.

Can I share URLs?

Yes, you can share browser URLs with anybody.  These URLs have a long number (a “sheet id”) that uniquely identifies the current sheet. For example:

https://canvas.voter-science.com/sheet/Index/e6f81e03af44436392ceaa909b5890cc

These urls are not secret. In other words, if user pastes this link into their browser, but does not have permission to the sheet, they will not be able to view the page.

In contrast, the secret canvas urls (which look like: https://canvas.voter-science.com/home/sheet?code=SECRET) , will grant permission to the current user, and then redirect (302) to a normal url with the sheet id.

If a secret URL is pasted in the browser, it will immediately do a permission check and then redirect (302) to a non-secret url. That ensures it’s safe to share urls you see in the browser.


Measuring the Trump Effect (Updated 11/15)

One of the most contentious elections in U.S. history is over and Donald J. Trump will be our next president.    Although Trump’s victory was moderately large in terms of the electoral vote, the closeness of the popular vote will prompt questions for Republicans moving forward, particularly in “blue” states such as Washington.  Just how did Trump do with Independent and soft Democrat voters in Washington state with whom Trump, though a polarizing figure, polled somewhat well since the early this year?


The question we wanted to answer was, “What exactly was the impact of Trump on Washington state races?”


Voter Science undertook a statistical modeling analysis of the early return data to assess Trump’s effect on local and statewide races.  We used data from ballot returns through Nov. 11th (with the understanding that final certified results will not be available for another several days).  Our statistical modeling utilized regression modeling using the form:

equation

Legislative district race results were modeled using Trump/Pence performance and other factors as predictors.  Performance deltas to Romney/Ryan 2012 were factored in to determine the detriment or improvement a legislative candidate received this cycle, what we’re calling the Trump Effect.


In general, we found that the Trump Effect amplified pre-existing voter preferences, giving Republican candidates a lift in predominantly “red” areas while dragging them down in places that would otherwise have been more likely to be closely contested.

Trump’s Impact on State Legislative Races: Tailwind or Drag?

For state legislative candidates, the Trump Effect depended largely on where you were.

The Trump Effect produced a “Trump Tailwind” for Republican legislative candidates in primarily Eastern and Southwest Washington.  The effect was particularly strong in Southwest Washington counties; Republican legislative candidates there received an average 5 to 6-point lift.

However, the Trump Effect was a net negative – “Trump Drag” – in many of Washington’s most populous counties, primarily those touching Interstate 5.  The Trump Drag was most evident in King County where the effect of the presidential ticket was to subtract an average of 5.2% from Republican legislative candidates.

Table 1: Net Impact of Trump Effect on Legislative Races (select counties updated 11/15)

updatedlegresults20161115


Figure 1: Net Impact of Trump Effect on Legislative Races by County

map_impact

The impact on legislative races was stark in some cases:

Table 2: Trump Effect Impact Select Races 

As of 11/10/16, Republicans running in King County have racked up four losses.  Even in the deeply red 5th Legislative District, there was a point at which all three seats were at risk, and although the two state House positions are currently leaning R in terms of returns, and the state Senate race is currently a loss but trending toward a possible late Republican win, our modeling predicted the margin should have been decisive at this point where it not for Trump Drag.

The 30th LD, where the Republican party worked so hard in 2015, has seen two star incumbents removed.  State Senator Steve Litzow in the 41st ran to a tie in the primary but lost by more than five points in the general.  Again, our predictive modeling indicated that Litzow should won handily; Trump Drag pulled roughly 3,800 votes from the R column in that race.

Statewide Races

Statewide Republican candidates suffered because of Trump Drag.  Overall losses to statewide candidates ran between 2 to 3 points and effectively made the races for Lands Commissioner and Auditor uncompetitive.  Were it not for the Trump Effect, both races would have been within 1 percentage points.

Table 3: Trump Effect Impact on Statewide Candidates

table_statewideraces

Depending on the race, the Trump Effect sliced off 50,000 to 70,000 votes from each of our key races.  Only Kim Wyman, the incumbent Secretary of State, fared better than the remaining slate of Republican candidates.

As with state legislative races, statewide candidates took the biggest hit in King County, a particularly rough Trump Effect because the county accounted for approximately two-thirds of the lost votes across all candidates.

Figure 2: Trump/Pence Performance as of Nov 12th

map_trump_results


Conclusions

Although many Republicans are celebrating Trump’s presidential victory, it is important to recognize this Trump Effect and what it says about the electorate here in Washington state.  A deep divide persists among Washingtonians that represents a major challenge moving forward.  How do Republicans reconnect with Independent and more conservative Democrats who have at times walked across party lines to vote for Republican candidates.  There is fertile opportunity to engage with these voters outside of the traditional social justice spectrum.  The final part of our challenge is identifying the hot button issues that these voters care about that have alignment with conservative values.


WA Voting Turnout Statistics

In WA state, voter turnout is at 52% [As 11/7/16].  A further breakdown shows Democrats are enjoying significant turnout advantage: Seattle turnout is at 58% whereas Yakima County turnout is 43%. Seattle is a traditional litmus test  for Democrat turnout, whereas Yakima County is a traditional litmus test for Republican turnout, especially in eastern Washington.

Low GOP turnout in eastern WA was a large factor in Rob McKenna’s 2012 loss. The above data is from the Secretary of State and County auditors. We can draw additional insights by join that with party identification scores [1].

Continue reading “WA Voting Turnout Statistics”

Late voter registration trends

Voter registration for Nov 8th, 2016 in WA  has closed and here’s a breakdown of some late registration trends.

The average age of a recently registered voters is 37, roughly 11 years younger than the average age of all voters. This trend is consistent across all 49 legislative districts.

Here’s a breakdown by legislative district, showing average ages of All voters, only voters registered 2016, and the difference between them.

Leg. District

All Voters

Registered in 2016

Difference

15

47.2

33.2

14.0

43

41.7

33.2

8.5

9

47.5

34.1

13.3

29

45.8

35.1

10.6

36

44.6

35.2

9.4

28

48.2

35.3

12.9

44

46.8

35.5

11.2

46

47.3

35.7

11.6

27

47.2

36.2

11.0

25

47.6

36.3

11.3

40

49.4

36.4

13.1

1

47.4

36.6

10.9

2

47.2

36.6

10.6

45

48.0

36.8

11.3

5

47.6

36.8

10.8

38

48.2

36.9

11.3

21

48.0

36.9

11.1

48

48.8

36.9

11.8

39

48.5

37.1

11.5

16

49.5

37.1

12.4

17

48.1

37.1

11.0

23

50.3

37.1

13.2

41

49.4

37.2

12.1

47

47.4

37.3

10.1

6

48.8

37.3

11.4

18

48.7

37.3

11.4

3

46.4

37.4

9.1

31

48.3

37.5

10.8

11

46.6

37.5

9.1

14

50.6

37.5

13.1

30

47.9

37.7

10.2

22

48.5

37.7

10.8

49

48.8

37.9

10.9

13

49.6

38.0

11.7

8

48.9

38.1

10.9

37

46.0

38.1

7.9

32

49.1

38.3

10.8

33

48.3

38.4

10.0

26

50.3

38.6

11.7

34

48.4

38.6

9.8

4

49.1

38.6

10.5

42

49.0

39.8

9.2

35

51.6

40.1

11.5

12

52.0

40.4

11.5

20

51.1

40.6

10.4

10

52.7

40.8

12.0

7

52.0

40.8

11.2

19

52.1

42.0

10.1

24

55.6

45.9

9.7

Districts average about a 1% increase from new registrations in ’16.

Here are the top 10 legislative districts by new-registration.

Leg. District

Number Voters

New Registrations

% growth

40

100,566

3,090

3.07%

43

118,302

2,516

2.13%

12

83,491

1,675

2.01%

22

108,232

2,066

1.91%

42

100,282

1,792

1.79%

13

78,080

1,389

1.78%

9

83,842

1,481

1.77%

8

89,393

1,567

1.75%

21

94,752

1,650

1.74%

3

86,858

1,511

1.74%

Here are some visualizations of the breakdown.

clip_image002[6] clip_image004[6]

clip_image006[6]


clip_image010[6]clip_image008[6]

clip_image012[7]

Have a question about the VRDB? Leave a comment…